Comparative Study
. 2008 May 15;180(10):6798-807.
doi: 10.4049/jimmunol.180.10.6798.

Early resolution of acute immune activation and induction of PD-1 in SIV-infected sooty mangabeys distinguishes nonpathogenic from pathogenic infection in rhesus macaques

Affiliations
Comparative Study

Early resolution of acute immune activation and induction of PD-1 in SIV-infected sooty mangabeys distinguishes nonpathogenic from pathogenic infection in rhesus macaques

Jacob D Estes et al. J Immunol. .

Abstract

Primate lentiviruses are typically apathogenic in their evolutionarily coadapted host species but can be lethal when transferred to new host species. Why such infections are pathogenic in humans and rhesus macaques (RMs) but not in sooty mangabeys (SMs), a natural host, remains unclear. Studies of chronically infected animals point to the importance of diminished immune activation in response to the infection in SMs. In this study, we sought the causes and timing of the differences in immune activation in a comparative study of acute SIV infection in RMs and SMs. Surprisingly, we show that in acute infection immune activation is comparable in SMs and RMs but thereafter, SMs quickly resolve immune activation, whereas RMs did not. Early resolution of immune activation in SMs correlated with increased expression of PD-1 and with preservation of CD4(+) T cell counts and lymphatic tissue architecture. These findings point to early control of immune activation by host immunoregulatory mechanisms as a major determinant of the different disease outcomes in SIV infection of natural vs non-natural hosts.


Figures

FIGURE 1
FIGURE 1
Early immune activation and resolution in SMs. A, Representative images of immunohistochemically stained secondary LT showing the level of cell proliferation measured as brown-stained Ki67+ cells in both RMs and SMs during acute and chronic infection. Scale bar = 50 μm. B, QIA of the frequency of Ki67+ cells/mm2 ± SEM within the TZ of LT in both RMs and SMs. C, Representative images of immunohistochemically stained secondary LT showing the level of activated cells measured as brown-stained CD25+ cells in both RMs and SMs during acute and chronic infection. Scale bar = 25 μm. D, QIA of the percentage of area ± SEM of the TZ that stained positive for CD25 in both RMs and SMs. E, Flow cytometric analysis of the mean proportion of CD4+Ki67+ (left) and CD8+Ki67+ (right) from lymph node (top) and peripheral blood (bottom).
FIGURE 2
FIGURE 2
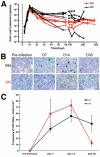
Preservation of CD4+ T cells and decreased apoptosis in LT of SMs but not RMs. A, Representative images of immunohistochemically stained secondary LT showing the level of CD4+ T cells in both RMs and SMs before infection and during chronic infection. Scale bar = 12.5 μm. B, Representative images of immunohistochemically stained secondary LT showing the level of apoptosis as measured by activated caspase 3-positive cells in both RMs and SMs during acute and chronic infection. Scale bar = 25 μm. C, QIA of the frequency ± SEM of activated caspase 3-positive cells/mm2 within the TZ of LT in both RMs and SMs.
FIGURE 3
FIGURE 3
Preservation of secondary LT architecture and fibrosis sparing in SM but not RMs and strong positive correlation between the level of activated Ki67+ and CD25+ cells and collagen I deposition. A, Representative fluorescent images show the early and progressive level of collagen I deposition (red-stained) in RMs and complete preservation of normal tissue architecture in SMs during acute and chronic infection. Scale bar = 25 μm. B, QIA of the percentage of area ± SEM of the TZ occupied by collagen I in both RMs and SMs. C, The level of Ki67+ proliferating cells (left panels) and CD25+ activated cells (right panels) in the TZ of secondary LT (solid line) mirrors the kinetics and magnitude of collagen I deposition (dashed line) in RMs (top panels) but attenuation of immune activation in SMs appears to protects LT from collagen deposition and fibrosis (bottom panels) ± SEM.
FIGURE 4
FIGURE 4
Differences in natural FoxP3+ regulatory T cell expression between SMs and RMs. A, Representative images of immunohistochemically stained secondary LT showing the level of brown-stained FoxP3+ cells in both RMs and SMs before infection and during acute and chronic infection. B, QIA of the frequency ± SEM of FoxP3+ cells/mm2 within the TZ before infection in both RMs and SMs.
FIGURE 5
FIGURE 5
Early induction of PD-1+ T cells in SMs, delayed induction in RMs, and PD-1+ cell types. A, Representative images of immunohistochemically stained secondary LT showing the density of brown-stained PD-1+ cells in both RMs and SMs during acute and chronic infection. Scale bar = 12.5 μm. B, QIA of the percentage of the area ± SEM of the TZ occupied by PD-1 in both RMs and SMs. C, Flow cytometric analysis of the mean proportion of CD4+PD-1+ and CD8+ PD-1+ from peripheral blood of RMs (black line) and SMs (red line) during the course of infection. D, Gating strategy showing the flow cytometric analysis of CD4+ and CD8+ naive, memory, and effector T cells. E, Flow cytometric analysis of the mean proportions of total, naive, memory, and effector CD4+PD-1+ (left) T cells and total, naive, memory, effector memory, and effector CD8+PD-1+ (right) T cells from peripheral blood of SIV-negative (□) SMs (n = 19) and naturally infected chronic SIV-positive (■) SMs (n = 32). F, Phenotypic confocal analysis of double-stained sections at day 14 with the fluorophore colors shown. In the merged images, only CD3+ T cells are PD-1+ (bottom left panel). Immunohistochemical staining for CD8 was unsuccessful in these fixed tissues. However, most CD3+PD-1+ cells were CD4 (bottom right panel) and thus ostensibly CD8+ T cells are the major population of PD-1+ cells at day 14 in SIV-infected SMs.
FIGURE 6
FIGURE 6
Early induction and subsequent decreases of granzyme B-positive effector T cells in SMs vs sustained high levels in RMs. A, Representative images of immunohistochemically stained secondary LT showing the level of brown-stained granzyme B-positive cells in both RMs and SMs during acute and chronic infection. Scale bar = 12.5 μm. B, QIA of the percentage of the area ± SEM of the TZ occupied by granzyme B in both RMs and SMs. C, The level ± SEM of granzyme B-positive effector cells (dashed line) in the TZ of secondary LT mirrors the kinetics of Ki67+ activated cells (solid line) in both RMs (top) and SMs (bottom). D, Phenotypic confocal analysis of double-stained sections at day 14 with PD-1 (green) and granzyme B (red) showing that virtually all PD-1+ T cells are granzyme B-negative.
FIGURE 7
FIGURE 7
Similar SIV replication in RMs and SMs during the acute stage of infection. A, Plasma viral loads over the course of infection. B, Representative images of SIV RNA-positive cells by in situ hybridization in LT. In developed radioautographs following in situ hybridization with 35S-labeled RNA riboprobes, SIV RNA-positive cells appear black in transmitted light. Scale bar = 12.5 μm. C, QIA of the frequency ± SEM of SIV RNA-positive cells/mm2 within LT of RMs and SMs.
FIGURE 8
FIGURE 8
Relationship between PD-1 expression, Ki67+ immune activation and granzyme B expression in SMs and RMs. PD-1 expression ± SEM (solid line) in SMs (right) mirror the kinetics of both Ki67+ activated (dashed line) cells (top) and granzyme B-positive (dashed line) effector cells (bottom), whereas in RMs (left) the increase in the levels of Ki67+ activated cells and granzyme B-positive effector cells over time was not affected by the expression level of PD-1.

References

    1. Silvestri G. Naturally SIV-infected sooty mangabeys: are we closer to understanding why they do not develop AIDS? J. Med. Primatol. 2005;34:243–252. - PubMed
    1. Johnson PR, Hirsch VM. Pathogenesis of AIDS: the non-human primate model. AIDS. 1991;5(Suppl 2):S43–S48. - PubMed
    1. Pandrea IV, Gautam R, Ribeiro RM, Brenchley JM, Butler IF, Pattison M, Rasmussen T, Marx PA, Silvestri G, Lackner AA, et al. Acute loss of intestinal CD4+ T cells is not predictive of simian immunodeficiency virus virulence. J. Immunol. 2007;179:3035–3046. - PMC - PubMed
    1. Gordon SN, Klatt NR, Bosinger SE, Brenchley JM, Milush JM, Engram JC, Dunham RM, Paiardini M, Klucking S, Danesh A, et al. Severe depletion of mucosal CD4+ T cells in AIDS-free simian immunodeficiency virus-infected sooty mangabeys. J. Immunol. 2007;179:3026–3034. - PMC - PubMed
    1. Silvestri G, Sodora DL, Koup RA, Paiardini M, O'Neil SP, McClure HM, Staprans SI, Feinberg MB. Nonpathogenic SIV infection of sooty mangabeys is characterized by limited bystander immunopathology despite chronic high-level viremia. Immunity. 2003;18:441–452. - PubMed

Publication types

MeSH terms

Substances