. 2008 May 15;180(10):6868-76.
doi: 10.4049/jimmunol.180.10.6868.

Lactoferrin acts as an alarmin to promote the recruitment and activation of APCs and antigen-specific immune responses

Affiliations

Lactoferrin acts as an alarmin to promote the recruitment and activation of APCs and antigen-specific immune responses

Gonzalo de la Rosa et al. J Immunol. .

Abstract

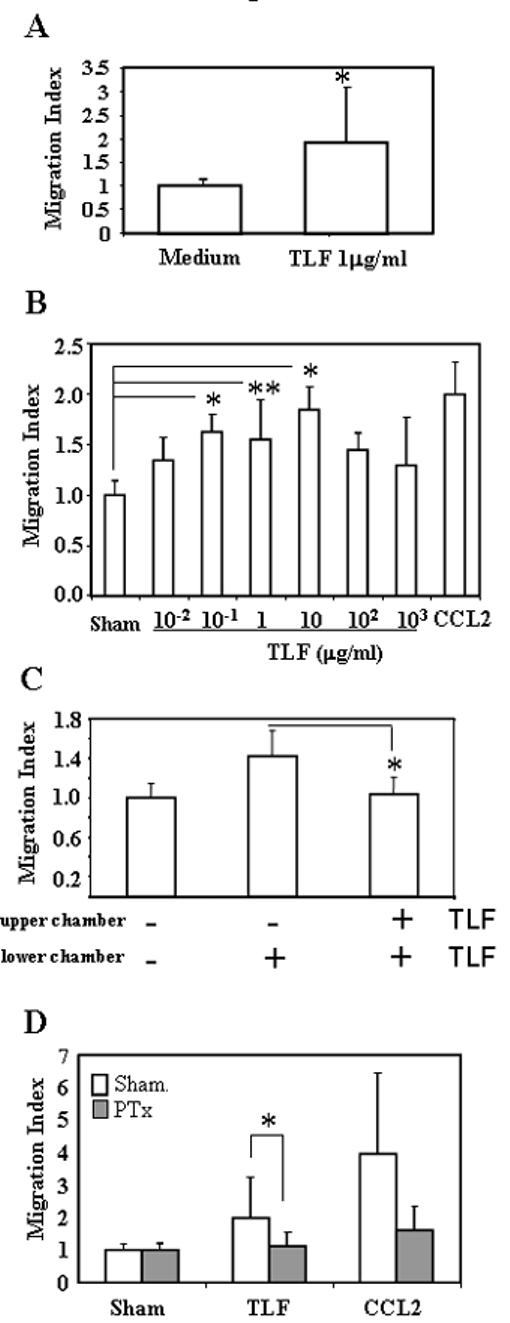
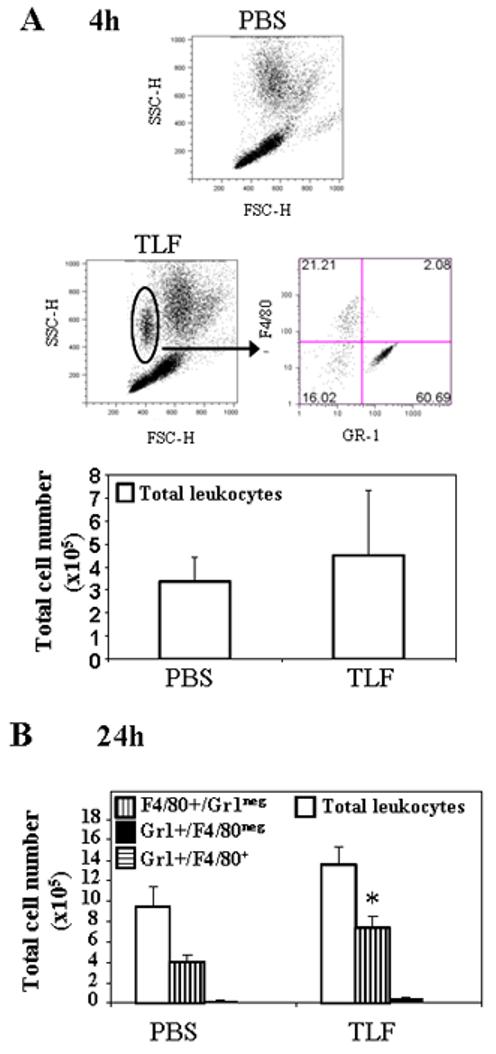
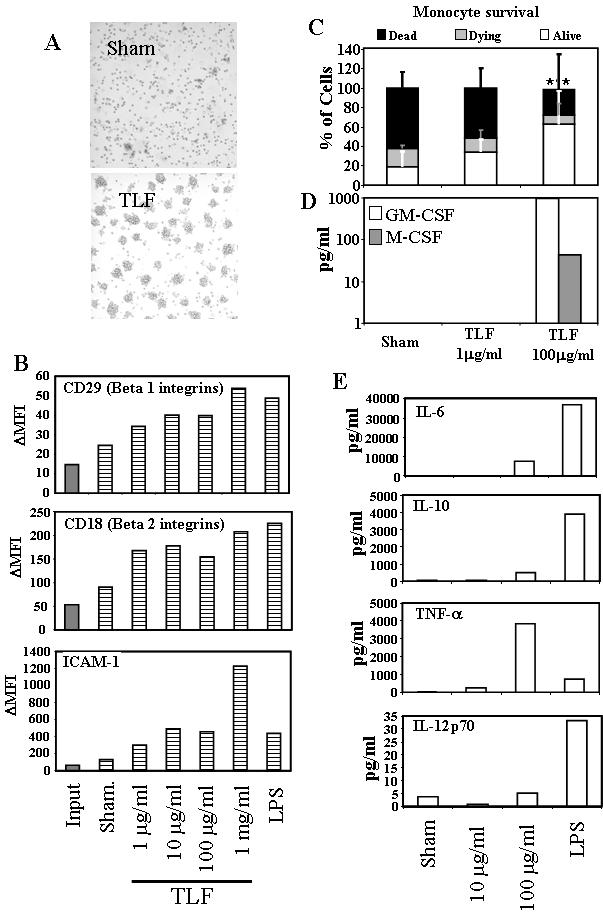
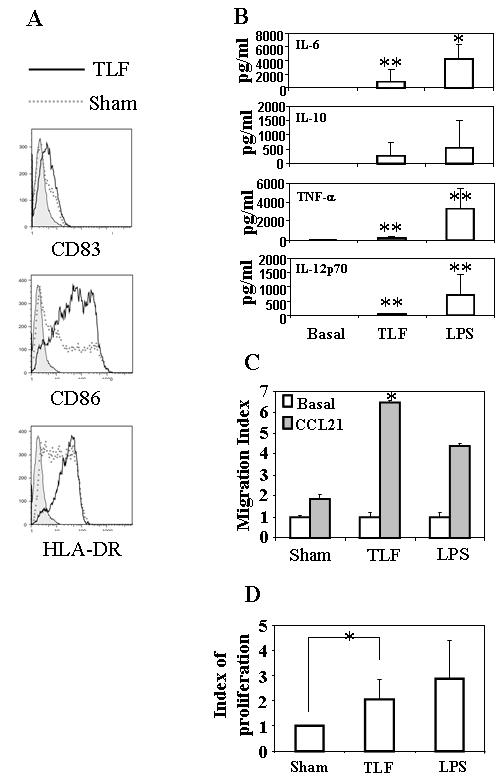
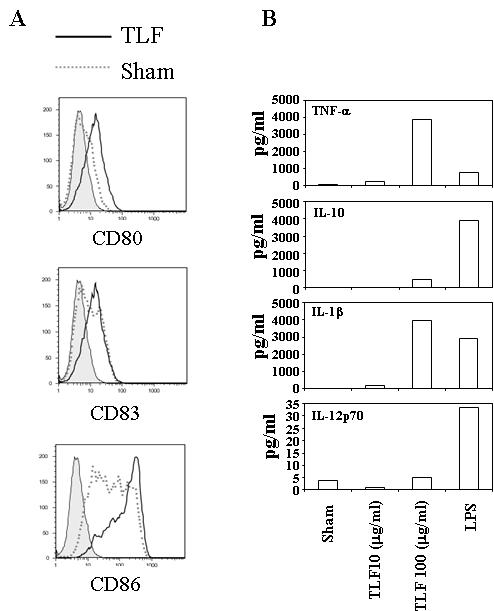
Lactoferrin is an 80-kDa iron-binding protein present at high concentrations in milk and in the granules of neutrophils. It possesses multiple activities, including antibacterial, antiviral, antifungal, and even antitumor effects. Most of its antimicrobial effects are due to direct interaction with pathogens, but a few reports show that it has direct interactions with cells of the immune system. In this study, we show the ability of recombinant human lactoferrin (talactoferrin alfa (TLF)) to chemoattract monocytes. What is more, addition of TLF to human peripheral blood or monocyte-derived dendritic cell cultures resulted in cell maturation, as evidenced by up-regulated expression of CD80, CD83, and CD86, production of proinflammatory cytokines, and increased capacity to stimulate the proliferation of allogeneic lymphocytes. When injected into the mouse peritoneal cavity, lactoferrin also caused a marked recruitment of neutrophils and macrophages. Immunization of mice with OVA in the presence of TLF promoted Th1-polarized Ag-specific immune responses. These results suggest that lactoferrin contributes to the activation of both the innate and adaptive immune responses by promoting the recruitment of leukocytes and activation of dendritic cells.


Figures

Fig. 1
Fig. 1. TLF induces monocyte migration
A) Monocyte migration was assayed using 48-well micro-chemotaxis chambers with the addition of monocytes (106/ml) and TLF in the upper and lower chambers, respectively. After 2 h of incubation, the membrane was scraped, fixed, and stained. Migrated monocytes were counted using Bioquant Life Science software. Results shown are the average +SD of seven experiments. *=p<0.01. B) Dose-response of monocyte migration to TLF. One experiment out of three is shown. C) Checkerboard analysis. Monocytes were allowed to migrate in the presence (+) of 1 μg/ml of TLF in the lower chamber or in both the upper and lower chambers. The results shown are the average (mean+SD) of three experiments. D) Effect of pertussis toxin (PTx). Monocytes were pretreated with 100 ng/ml PTx for 1 h at 37°C prior to utilization in the migration assay. 100ng/ml of CCL2 was used as a positive control for monocyte migration and to confirm the effect of PTx. The data show the average (mean+SD) of 4 experiments. *p<0.01; **p<0.05.
Fig. 2
Fig. 2. Lactoferrin recruitment of neutrophils and monocytes/macrophages in vivo
1 μg/ml of TLF or PBS was i.p. injected into C57BL/6 mice (n=3). After 4h (A) or 24h (B) mice were sacrificed and the peritoneal cavity was rinsed with 5 ml of cold PBS containing 5 mM EDTA to recover peritoneal leukocytes. The recovered cells were counted and stained to analyze the phenotype by flow cytometry. The result of one representative experiment out of three is shown. *=p<0.01.
Fig. 3
Fig. 3. Lactoferrin activation of monocytes
Monocytes were cultured at 106/ml in the presence or absence of TLF at different concentrations or LPS at 200 ng/ml for 48h. A) Microscopic images (20× magnification) showing cell distribution in monocyte cultures. TLF concentration = 10 μg/ml. B) Analysis by FACS of the expression of adhesion molecules in monocytes at day 0 (Input) and after 48 h (dashed bars) culture without or with lactoferrin or LPS. Mean fluorescence intensity increment (ΔMFI) was obtained by subtracting the MFI of the isotype control from the experimental MFI. The results of one representative experiment out of two is shown. (C) Monocytes were treated for 24 h under conditions specified and counted by flow cytometry and stained with FITC-conjugated annexin V and PI. Double-negative (DN) and annexin V+ events are plotted. Data is presented as % of cells relative to the initial population plated (100%) The results are the average (mean+SD) of four individual experiments. DN populations were compared to analyze statistical significance. **=p<0.05. (D and E) Supernatants of 48h-cultured monocytes were measured for cytokine concentrations. The results of one experiment representative of three and one out of two, respectively, are shown.
Fig. 4
Fig. 4. Lactoferrin induction of moDC activation
(A). Monocyte-derived DCs (moDCs) were cultured in the absence (sham) or presence of TLF at 10 μg/ml. After 48 h, the expression of CD83, CD86 and HLA-DR was analyzed by flow cytometry. Shown is the overlay histograms of isotope-control (filled), sham (dashed lines), and TLF treatment (bold lines) of one experiment representative of seven. (B) Supernatants of moDCs cultured for 48 h in the absence (sham) or presence of TLF (10 μg/ml) or LPS (200 ng/ml) were measured for cytokines by ELISA. The results shown are the average (mean+SD) of five separate experiments (C) The migration of moDCs incubated in the absence (sham) or presence of TLF (10 μg/ml) or LPS (500 ng/ml) for 48 h in response to SLC/CCL21 were measured by 48-well microchemotaxis chamber assay. The results of one experiment representative of two are shown. (D) moDCs cultured without or with TLF (10 μg/ml) or LPS (1 μg/ml) for 48 h were mixed with allogeneic peripheral blood lymphocytes (105/well) at a ratio of 1:100 and cultured (in triplicate) for 4∼5 days. The cultures were pulsed with 3H-TdR (1 μCr/well) for the last 16 h before harvested for the measurement of 3H-TdR incorporation. Lymphocyte proliferation was shown as proliferation index, which was calculated as [CPM of the well with TLF- or LPS-treated DCs]/[CPM of the well with sham-treated DCs]. Data represent the average (mean+SD) of seven separate experiments. *=p<0.01; **=p<0.05.
Fig. 5
Fig. 5. Lactoferrin enhancement of the maturation of peripheral blood dendritic cells (PBDCs)
(A) PBMCs were cultured for 40 h in RPMI 1640 containing 5% FCS with or without TLF (100 μg/ml) or LPS (200 ng/ml). The cells were subsequently stained to analyze by flow cytometry CD80, CD83, and CD86 expression by gating on CD1c+ PBDCs subset. Data shown are the results of one experiment representative of four. B) Purified CD1c+ PBDCs were cultured (105/well) in RPMI-5%FCS for 48 h in the presence of TLF (10 μg/ml) or LPS (500 ng/ml). The supernatants were collected for the measurement of cytokine production. The results of one experiment representative of two are shown.
Fig. 6
Fig. 6. Lactoferrin reduction of lymphocyte and Treg numbers in vitro cultured PBMCs
A) PBMCs cultured at 1×10⁶/ml in the absence (sham) or presence of TLF (1∼1000 μg/ml) for 48 h were stained with FITC-conjugated annexin V and PI and analyzed by flow cytometry. Lymphocytes were gated based on forward scatter and side scatter characteristics. Data is presented as % of cells respect to the initial population plated (100%); DN populations were compared to analyze statistical significance. B) and C) PBMCs were cultured in RPMI 1640 containing 10% FBS, 100 U/ml of IL-2, and 50 ng/ml of TNFα in the absence (sham) or presence of 100 μg/ml of TLF for 48 h. B) Subsequently, the cultured cells were stained for CD3, CD4, and FoxP3, and analyzed by flow cytometry. Dot plots show the phenotype of one representative experiment out of five and the numbers within each gate correspond to the percentage of gated events. C) The percentageof Treg (CD3+/CD4+/FoxP3+) within total CD3+ T lymphocyte population of five individual experiments are plotted.*=p<0.01; **=p<0.05.
Fig. 7
Fig. 7. Lactoferrin enhancement of antigen-specific immune response
C56BL/6 mice (n=4) were i.p. immunized with OVA (50 μg/mouse) in the absence or presence of TLF or alum (as a positive control) on day 1, boosted i.p. with OVA alone on day 14, and euthanized on day 21 for the removal of spleens and preparation of single splenocyte suspension. (A) OVA-specific proliferation of splenocytes. Splenocytes were cultured in triplicate in a 96-well plate at 5×10⁵/well in the presence of various concentrations of OVA for 60 h and pulsed with 0.5 μCi/well of 3H-TdR for the last 18 h. The proliferation of splenocytes was measured as 3H-TdR incorporation and shown as the average (mean±SD) of four mice. (B) Pooled splenocytes of each group were cultured in duplicate in a 24-well plate at 5×10⁶/1 ml/well in RPMI 1640 containing 10% FBS and 50 μg/ml of OVA for 48 h before harvesting the supernatants for cytokine measurement. Shown are the average (mean±SD) cytokine concentration of duplicate wells. Similar results were obtained in two independent experiments *p<0.01 compared with the group immunized with OVA alone.

Similar articles

Cited by

References

    1. Johanson B. Isolation of an iron-containing red protein from human milk. Acta Chem. Scand. 1960:510–512.
    1. Montreuil J, Tonnelat J, Mullet S. [Preparation and properties of lactosiderophilin (lactotransferrin) of human milk.] Biochim Biophys Acta. 1960;45:413–421. - PubMed
    1. Houghton MR, Gracey M, Burke V, Bottrell C, Spargo RM. Breast milk lactoferrin levels in relation to maternal nutritional status. J Pediatr Gastroenterol Nutr. 1985;4:230–233. - PubMed
    1. Masson PL, Heremans JF, Schonne E. Lactoferrin, an iron-binding protein in neutrophilic leukocytes. J Exp Med. 1969;130:643–658. - PMC - PubMed
    1. Baggiolini M, De Duve C, Masson PL, Heremans JF. Association of lactoferrin with specific granules in rabbit heterophil leukocytes. J Exp Med. 1970;131:559–570. - PMC - PubMed

Publication types