The power of spectral density analysis for mapping endogenous BOLD signal fluctuations
- PMID: 18454458
- PMCID: PMC5441229
- DOI: 10.1002/hbm.20601
The power of spectral density analysis for mapping endogenous BOLD signal fluctuations
Abstract
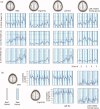
FMRI has revealed the presence of correlated low-frequency cerebro-vascular oscillations within functional brain systems, which are thought to reflect an intrinsic feature of large-scale neural activity. The spatial correlations shown by these fluctuations has been their identifying feature, distinguishing them from fluctuations associated with other processes. Major analysis methods characterize these correlations, identifying networks and their interactions with various factors. However, other analysis approaches are required to fully characterize the regional signal dynamics contributing to these correlations between regions. In this study we show that analysis of the power spectral density (PSD) of regional signals can identify changes in oscillatory dynamics across conditions, and is able to characterize the nature and spatial extent of signal changes underlying changes in measures of connectivity. We analyzed spectral density changes in sessions consisting of both resting-state scans and scans recording 2 min blocks of continuous unilateral finger tapping and rest. We assessed the relationship of PSD and connectivity measures by additionally tracking correlations between selected motor regions. Spectral density gradually increased in gray and white matter during the experiment. Finger tapping produced widespread decreases in low-frequency spectral density. This change was symmetric across the cortex, and extended beyond both the lateralized task-related signal increases, and the established "resting-state" motor network. Correlations between motor regions also reduced with task performance. In conclusion, analysis of PSD is a sensitive method for detecting and characterizing BOLD signal oscillations that can enhance the analysis of network connectivity.
(c) 2008 Wiley-Liss, Inc.
Figures


References
-
- Arfanakis K,Cordes D,Haughton VM,Moritz CH,Quigley MA,Meyerand ME ( 2000): Combining independent component analysis and correlation analysis to probe interregional connectivity in fMRI task activation datasets. Magn Reson Imaging 18: 921–930. - PubMed
-
- Birn RM,Diamond JB,Smith MA,Bandettini PA ( 2006): Separating respiratory‐variation‐related fluctuations from neuronal‐activity‐related fluctuations in fMRI. Neuroimage 31: 1536–1548. - PubMed
-
- Biswal B,Yetkin FZ,Haughton VM,Hyde JS ( 1995): Functional connectivity in the motor cortex of resting human brain using echo‐planar MRI. Magn Reson Med 34: 537–541. - PubMed
MeSH terms
Grants and funding
LinkOut - more resources
Full Text Sources
Medical

