. 2008 May 27;47(21):5869-80.
doi: 10.1021/bi7023282. Epub 2008 May 3.

Shotgun lipidomics reveals the temporally dependent, highly diversified cardiolipin profile in the mammalian brain: temporally coordinated postnatal diversification of cardiolipin molecular species with neuronal remodeling

Affiliations

Shotgun lipidomics reveals the temporally dependent, highly diversified cardiolipin profile in the mammalian brain: temporally coordinated postnatal diversification of cardiolipin molecular species with neuronal remodeling

Hua Cheng et al. Biochemistry. .

Abstract

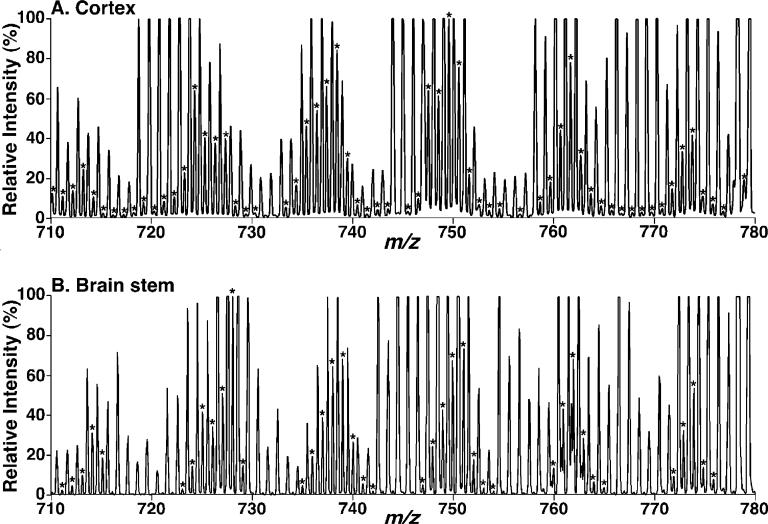
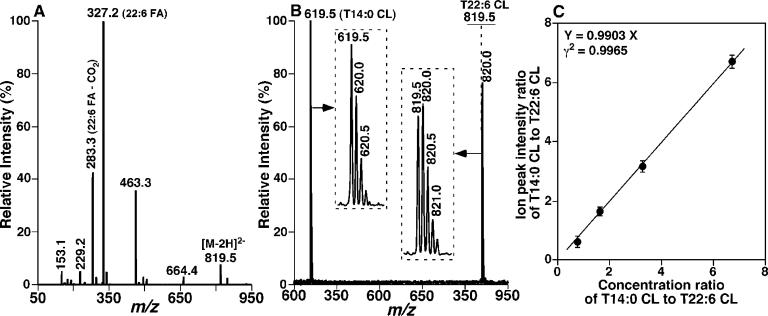
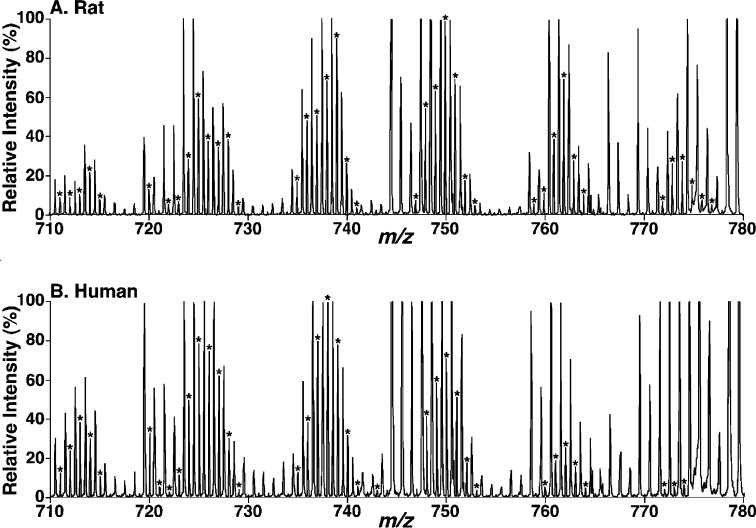
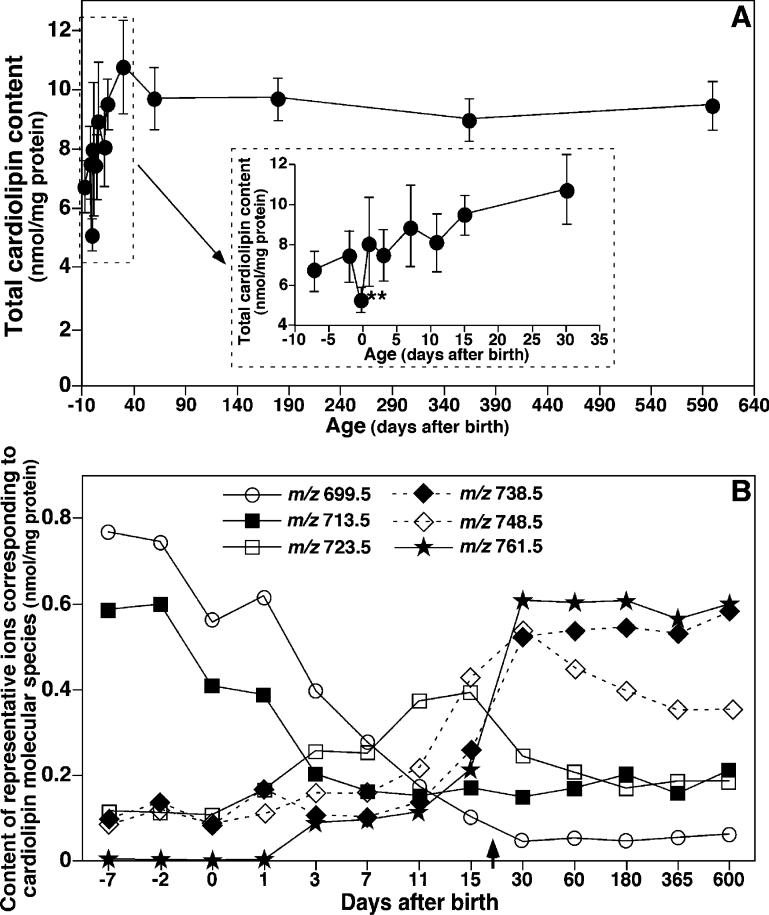
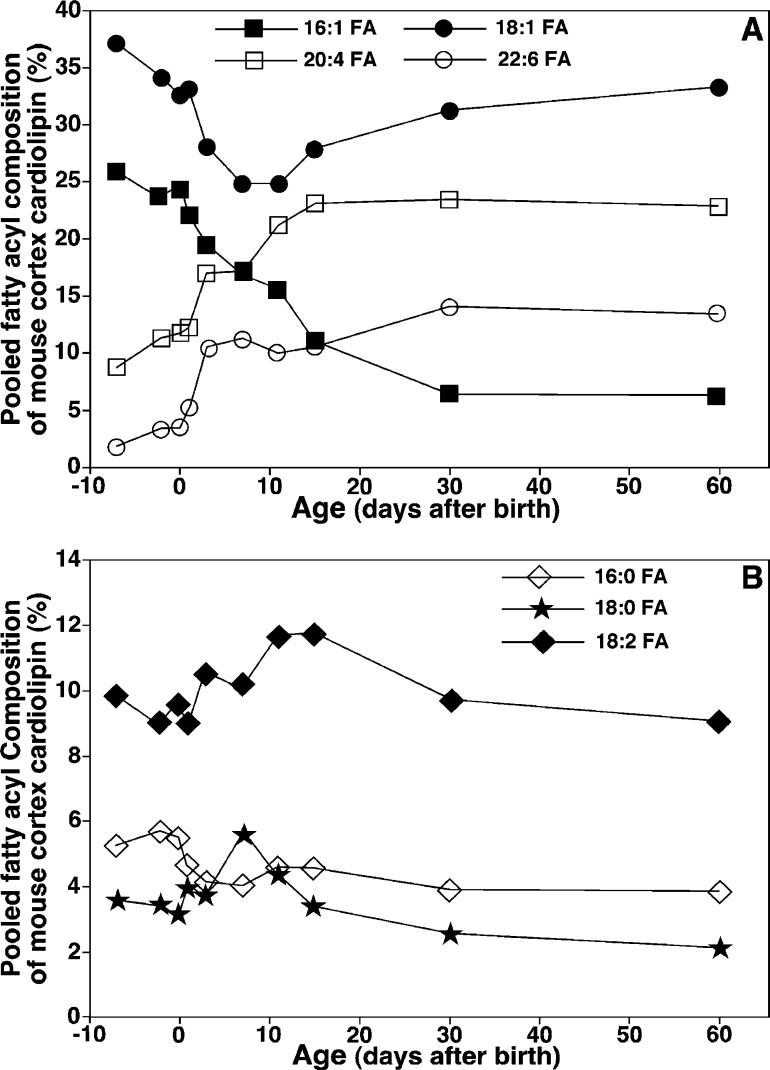
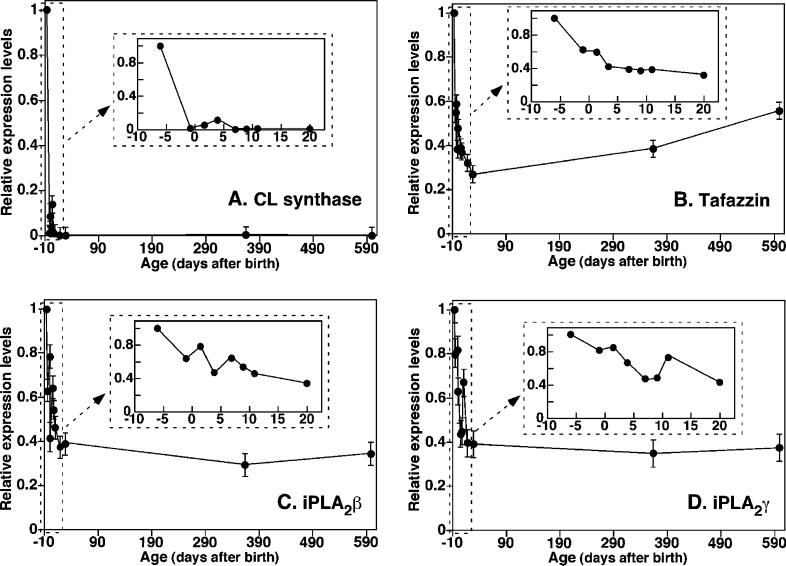
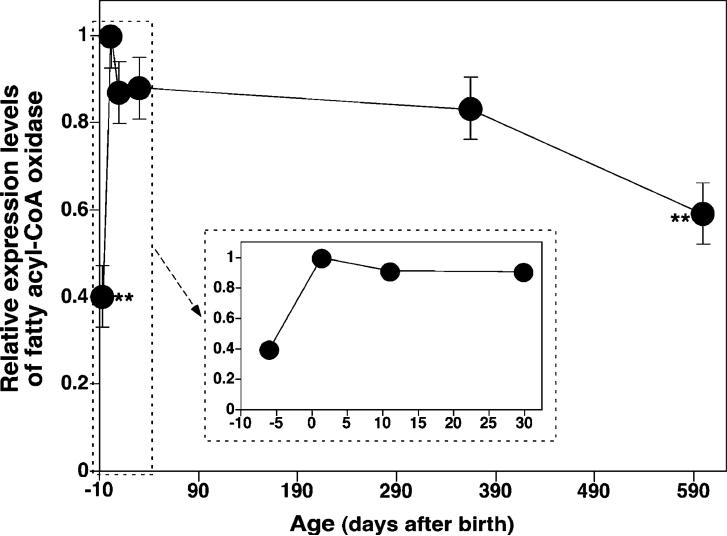
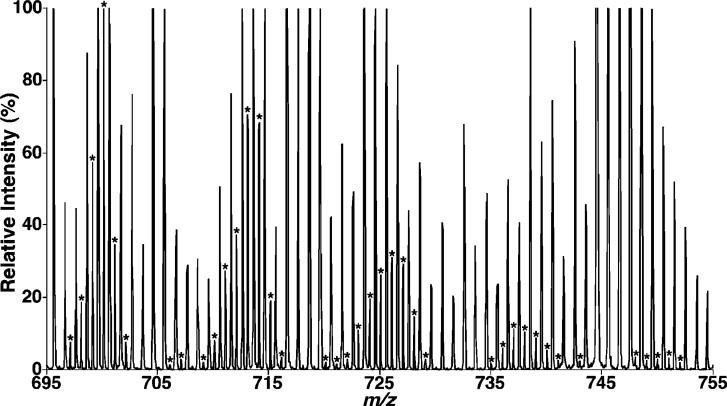
Large-scale neuronal remodeling through apoptosis occurs shortly after birth in all known mammalian species. Apoptosis, in large part, depends upon critical interactions between mitochondrial membranes and cytochrome c. Herein, we examined the hypothesis that the large-scale reorganization of neuronal circuitry after birth is accompanied by profound alterations in cardiolipin (CL) content and molecular species distribution. During embryonic development, over 100 CL molecular species were identified and quantitated in murine neuronal tissues. The embryonic CL profile was notable for the presence of abundant amounts of relatively short aliphatic chains (e.g., palmitoleic and oleic acids). In sharp contrast, after birth, the CL profile contained a remarkably complex repertoire of CL molecular species, in which the signaling fatty acids (i.e., arachidonic and docosahexaenoic acids) were markedly increased. These results identify the rapid remodeling of CL in the perinatal period with resultant alterations in the physical properties of the mitochondrial membrane. The complex distribution of aliphatic chains in the neuronal CL pool is separate and distinct from that in other organs (e.g., heart, liver, etc.), where CL molecular species contain predominantly only one major type of aliphatic chain (e.g., linoleic acid). Analyses of mRNA levels by real-time quantitative polymerase chain reactions suggested that the alterations in CL content were due to the combined effects of both attenuation of de novo CL biosynthesis and decreased remodeling of CL. Collectively, these results provide a new perspective on the complexity of CL in neuronal signaling, mitochondrial bioenergetics, and apoptosis.


Figures

Figure 1
Figure 1
Expanded negative-ion ESI mass spectra of mouse brain lipid extracts obtained using a QqTOF mass spectrometer. Lipid extracts of mouse cortex (A) and brain stem (B) were prepared by a modified Bligh and Dyer procedure, and electrospray ionization mass spectra were acquired in the negative-ion mode using a QqTOF mass spectrometer as described under the Materials and Methods. The asterisks indicate the identified CL plus-one isotopologues, which were characteristic of the doubly charged CL molecular species and were used to quantify individual CL molecular species based on ion intensity as previously described (10). Each spectrum is displayed after being normalized to the most abundant CL plus-one isotopologue.
Figure 2
Figure 2
Electrospray ionization mass spectrometric analyses of synthesized tetra22:6 cardiolipin. (A) Product ion mass spectrum of m/z 819.5, from which the selected ion can be identified as T22:6 CL. (B) Representative negative-ion ESI mass spectrum of an equimolar mixture of T14:0 CL and T22:6 CL (1 pmol/μL each). The insets display the isotopologue patterns of the ions. The horizontal line over the ion peak at m/z 819.5 represents the monoisotopic ion peak intensity after 13C de-isotoping and has been normalized to that at m/z 619.5. (C) Linear correlation between the concentration ratios and the ion peak intensity ratios of T14:0 CL and T22:6 CL. The data points represent the mean ± SD determined at a variety of concentrations. These results indicate that the ionization response factors of T14:0 CL and T22:6 are essentially identical within experimental errors after 13C de-isotoping.
Figure 3
Figure 3
Expanded representative negative-ion ESI mass spectra of lipid extracts of rat and human brain samples using a QqTOF mass spectrometer. Lipid extracts of rat cortex (A) and human cortex (B) were prepared by a modified Bligh and Dyer procedure, and electrospray ionization mass spectra were acquired in the negative-ion mode using a QqTOF mass spectrometer as described under the Materials and Methods. The asterisks indicate the identified CL plus-one isotopologues, which were characteristic of doubly charged CL molecular species and were used to quantify individual CL molecular species based on ion intensity as previously described (10). Each spectrum is displayed after being normalized to the most abundant CL plus-one isotopologue.
Figure 4
Figure 4
Temporal changes in the contents of total CL and representative CL molecular species in lipid extracts of mouse cortex. Lipid extracts of mouse cortex at different ages before and after birth were prepared using a modified Bligh and Dyer method. The content of each individual CL molecular species after identification were calculated in comparison to the selected internal standard after 13C de-isotoping as described under the Materials and Methods. (A) Temporal changes in the content of total CL, which was summarized from the determined contents of individual CL molecular species in mouse cortex before and after birth. The inset of A displays the region of the graph during the pre- and postnatal periods. (B) Temporal changes in the levels of multiple CL molecular species (as indicated and representative of the different mass regions) in lipid extracts of mouse cortex before and after birth. It should be noted that the scale of the x axis in B is random and represents the days when the animals were sacrificed after birth. Negative signs represent the number of days before birth. The data points represent mean ± SD from separate preparations of at least four different animals. The error bars in B are within the symbols. The arrow in B indicates the weaning time.
Figure 5
Figure 5
Temporal changes of the FA composition of CL molecular species in mouse cortex before and after birth. The composition of the selected individual FA chains (as indicated) of the CL pool in mouse cortex were calculated from the determined averaged contents of individual CL molecular species as similarly described in the caption of Figure 4.
Figure 6
Figure 6
Temporal changes of the relative mRNA levels of select CL biosynthetic and remodeling enzymes in mouse cortex before and after birth using quantitative real-time PCR analyses. Total RNA was isolated, and quantitative PCR was performed as described under the Materials and Methods. The forward and reverse primers as well as probes for CL synthase (A), tafazzin (B), calcium-independent phospholipase A2β (iPLA2β) (C) and iPLA2γ (D) used in the analyses are listed under the Materials and Methods. Data represent the mean ± SD from separate preparations and analyses of at least three different animals. Data are expressed as normalized arbitrary units, with message levels normalized to that of mouse GAPDH, which was used as an internal control. The inset of each panel expands the pre- and postnatal time period.
Figure 7
Figure 7
Temporal changes of the relative mRNA levels of FACO in mouse cortex before and after birth using quantitative real-time RT-PCR analyses. Total RNA was isolated, and quantitative PCR was performed as described under the Materials and Methods. The forward and reverse primers as well as the probe for FACO used in the analyses were listed under the Materials and Methods. Data represent the mean ± SD from each of the separate preparations and analyses of at least three different animals. Data are expressed as normalized arbitrary units, with message levels normalized to that of mouse GAPDH, which was used as an internal control. The inset expands the region near the birth time.
Figure 8
Figure 8
Expanded negative-ion ESI mass spectrum of lipid extracts of primary neuronal cultures using a QqTOF mass spectrometer. Lipid extracts of cultured cells were prepared by a modified Bligh and Dyer procedure, and an ESI mass spectrum was acquired in the negative-ion mode using a QqTOF mass spectrometer as described under the Materials and Methods. The asterisks indicate the recognizable CL plus-one isotopologues, which were characteristic of doubly charged CL molecular species and were used to quantify individual CL molecular species based on ion intensity as previously described (10). The spectrum is displayed after being normalized to the most abundant CL plus-one isotopologue.

References

    1. Schlame M, Rua D, Greenberg ML. The biosynthesis and functional role of cardiolipin. Prog. Lipid Res. 2000;39:257–288. - PubMed
    1. Hoch FL. Cardiolipins and biomembrane function. Biochim. Biophys. Acta. 1992;1113:71–133. - PubMed
    1. Hatch GM. Cell biology of cardiac mitochondrial phospholipids. Biochem. Cell Biol. 2004;82:99–112. - PubMed
    1. Petrosillo G, Ruggiero FM, Paradies G. Role of reactive oxygen species and cardiolipin in the release of cytochrome c from mitochondria. FASEB J. 2003;17:2202–2208. - PubMed
    1. Iverson SL, Orrenius S. The cardiolipin—cytochrome c interaction and the mitochondrial regulation of apoptosis. Arch. Biochem. Biophys. 2004;423:37–46. - PubMed

Publication types

LinkOut - more resources