. 2008 Jul-Aug;1777(7-8):1044-52.
doi: 10.1016/j.bbabio.2008.04.008. Epub 2008 Apr 11.

The dimeric structure of the cytochrome bc(1) complex prevents center P inhibition by reverse reactions at center N

Affiliations

The dimeric structure of the cytochrome bc(1) complex prevents center P inhibition by reverse reactions at center N

Raul Covian et al. Biochim Biophys Acta. 2008 Jul-Aug.

Abstract

Energy transduction in the cytochrome bc(1) complex is achieved by catalyzing opposite oxido-reduction reactions at two different quinone binding sites. We have determined the pre-steady state kinetics of cytochrome b and c(1) reduction at varying quinol/quinone ratios in the isolated yeast bc(1) complex to investigate the mechanisms that minimize inhibition of quinol oxidation at center P by reduction of the b(H) heme through center N. The faster rate of initial cytochrome b reduction as well as its lower sensitivity to quinone concentrations with respect to cytochrome c(1) reduction indicated that the b(H) hemes equilibrated with the quinone pool through center N before significant catalysis at center P occurred. The extent of this initial cytochrome b reduction corresponded to a level of b(H) heme reduction of 33%-55% depending on the quinol/quinone ratio. The extent of initial cytochrome c(1) reduction remained constant as long as the fast electron equilibration through center N reduced no more than 50% of the b(H) hemes. Using kinetic modeling, the resilience of center P catalysis to inhibition caused by partial pre-reduction of the b(H) hemes was explained using kinetics in terms of the dimeric structure of the bc(1) complex which allows electrons to equilibrate between monomers.


Figures

Fig. 1
Fig. 1. Models used for the kinetic simulation of electron equilibration through center N
The dimeric model (left) assumed that electrons could equilibrate between the bH hemes in each monomer with a rate defined as kIM. For clarity, not all the possible reactions between species are shown, but were included in the simulations The monomeric model (right) considered each center N site as isolated from the other monomer, with electron equilibration occurring only between the bH heme and quinol (QH2) or semiquinone (SQ). Kinetic constants refer to the association and dissociation rates for quinol (kaQH, kdQH), and quinone (kaQ, kdQ), as well as to the forward and reverse rates of conversion of quinol to semiquinone (k1 and k_1) and of semiquinone to quinone (k2 and k_2). The values assigned to each constant are explained under “Materials and methods”.
Fig. 2
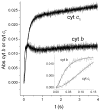
Fig. 2. Pre-steady state reduction of cytochrome b and cytochrome c1 in the yeast cytochrome bc1 complex
Traces show the reduction kinetics of 1 μM yeast bc1 complex 7.5 μM decyl-ubiquinol in the presence of 22.5 μM decyl-ubiquinone measured at 562–578 nm (cytochrome b) and 554–539 nm (cytochrome c1, corrected for the spectral contribution of cytochrome b as explained in Ref. 34). The solid curves correspond to the best fit to a third order (b) or second order (c1) exponential function. Fitted values for cytochrome b were k1 = 21 ± 0.7 s−1 (Abs 0.015 ± 0.0004), k2 = 2.5 ± 0.4 s−1 (Abs −0.007 ± 0.001), k3 = 0.8 ± 0.2 (Abs 0.004 ± 0.001). For cytochrome c1, the fitted values were k1 = 5.6 ± 0.06 s−1 (Abs 0.022 ± 0.0001), k2 = 0.9 ± 0.02 s−1 (Abs 0.013 ± 0.003).
Fig. 3
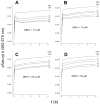
Fig. 3. Pre-steady state reduction of cytochrome b as a function of quinol and quinone concentration
Cytochrome b reduction traces were obtained by reducing 1 μM yeast bc1 complex with the indicated concentrations of decyl-ubiquinol (DBH2) in the presence of varying decyl-ubiquinone (DBQ) concentrations. The experimental data points were then fitted to a second or third order exponential function. For clarity, the experimental traces have been removed to show only the fitted curves.
Fig. 4
Fig. 4. Initial rates of cytochrome b and cytochrome c1 reduction at different quinol and quinone concentrations
The rates obtained for the first kinetic phase of cytochrome b (panel A) and cytochrome c1 (panel B) reduction by 7.5 μM (squares), 15 μM (circles), 22.5 μM (up triangles), and 30 μM (down triangles) of decyl-ubiquinol in the presence of different decyl-ubiquinone (DBQ) concentrations were fitted to a simple inhibition function. The Ki values for decyl-ubiquinone obtained from fitting the rates of cytochrome b reduction (A) were in the range of 150–200 μM, while those obtained for the rates of cytochrome c1 reduction (B) were all close to 45 μM.
Fig. 5
Fig. 5. Pre-steady state reduction of the yeast cytochrome bc1 complex at different quinol/quinone ratios
The best-fit curves obtained from the experimental traces of cytochrome b and cytochrome c1 reduction were plotted as a function of the proportion of bH (panel A) and c1 (panel B) hemes reduced using their corresponding extinction coefficients. The sum of decyl-ubiquinol and decyl-ubiquinone was maintained at a fixed concentration of 30 μM in all cases. The quinol/quinone ratio of >30 corresponds to 30 μM decyl-ubiquinol with no decyl-ubiquinone added. The only quinone present in this case was the ~0.9 μM of endogenous ubiquinone copurified with the enzyme.
Fig. 6
Fig. 6. Simulations of electron equilibration through center N at different quinol/quinone ratios
The models shown in Fig. 1 were used in the Dynafit program to simulate the kinetics of formation of different enzyme species upon equilibration of the quinol and quinone at the indicated ratios with the bH hemes through center N. The species labeled as “dimer” were obtained using a dimeric model that assumes electron equilibration between the two bH hemes. The species labeled “monomer” was calculated by assuming that no electron crossover in the dimer is possible. Details on the models are provided under “Materials and methods”.
Fig. 7
Fig. 7. Electron equilibration in the bc1 complex dimer
Some of the possible conformations of the dimer formed upon equilibration of electrons through center N (intermediates I-III and I-III′) before catalysis at center P occurs (intermediates IVa, IVb, IVa′, and IVb′) are shown. As more fully explained under “Discussion”, electron crossover between monomers via the bL hemes (as shown in the formation of intermediates II, IVb and IVa′) allows quinol oxidation at center P even at dimers where one bH heme has been pre-reduced through center N.

Similar articles

Cited by

References

    1. Zhang ZL, Huang LS, Shulmeister VM, Chi YI, Kim KK, Hung LW, Crofts AR, Berry EA, Kim SH. Electron transfer by domain movement in cytochrome bc1. Nature. 1998;392:677–684. - PubMed
    1. Yu CA, Xia D, Kim H, Deisenhofer J, Zhang L, Kachurin AM, Yu L. Structural basis of functions of the mitochondrial bc1 complex. Biochim Biophys Acta. 1998;1365:151–158. - PubMed
    1. Iwata S, Lee JW, Okada K, Lee JK, Iwata M, Rasmussen B, Link TA, Ramaswamy S, Jap BK. Complete structure of the 11-subunit bovine mitochondrial cytochrome bc1 complex. Science. 1998;281:64–71. - PubMed
    1. Hunte C, Koepke J, Lange C, Rossmanith T, Michel H. Structure at 2.3 Å resolution of the cytochrome bc1 complex from the yeast Saccharomyces cerevisiae co-crystallized with an antibody Fv fragment. Structure. 2000;8:669–684. - PubMed
    1. Berry EA, Huang LS, Saechao LK, Pon NG, Valkova-Valchanova M, Daldal F. X-Ray Structure of Rhodobacter capsulatus cytochrome bc1: Comparison with its mitochondrial and chloroplast counterparts. Photosynth Res. 2004;81:251–275. - PubMed

MeSH terms

LinkOut - more resources