

doi: 10.1016/j.ccr.2008.03.015.
Survival of cancer cells is maintained by EGFR independent of its kinase activity
Affiliations
- PMID: 18455122
- PMCID: PMC2413063
- DOI: 10.1016/j.ccr.2008.03.015
Item in Clipboard
Survival of cancer cells is maintained by EGFR independent of its kinase activity
Cancer Cell.
2008 May.
Abstract
Expression of the epidermal growth factor receptor (EGFR), a receptor tyrosine kinase associated with cell proliferation and survival, is overactive in many tumors of epithelial origin. Blockade of the kinase activity of EGFR has been used for cancer therapy; however, by itself, it does not seem to reach maximum therapeutic efficacy. We report here that in human cancer cells, the function of kinase-independent EGFR is to prevent autophagic cell death by maintaining intracellular glucose level through interaction and stabilization of the sodium/glucose cotransporter 1 (SGLT1).
Figures
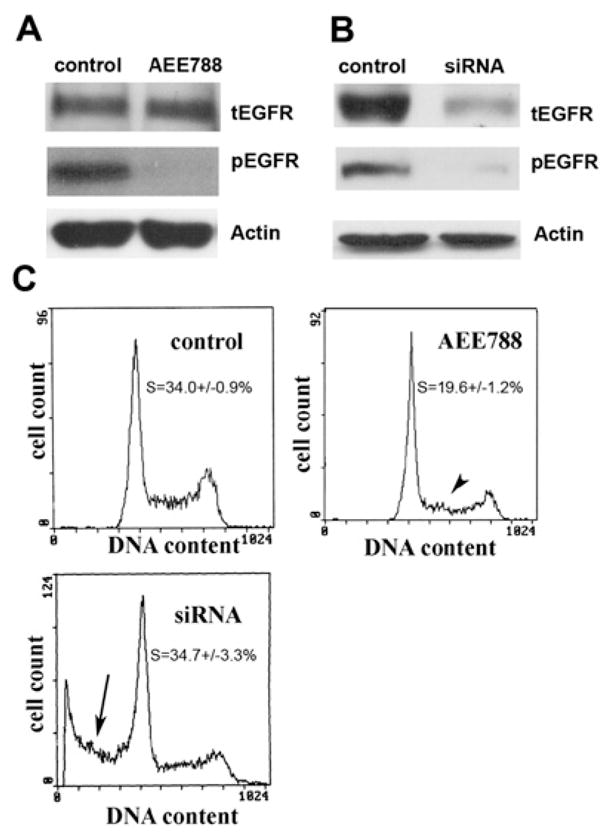
(A) PC3MM2 cells grown in MEM with 5.5 mM glucose were treated with AEE788 (5.0 μM, with AEE788 readded every 24 hr) for 72 hr. Western blot analysis revealed that pEGFR was completely blocked by AEE788 compared with the control. β-actin served as a loading control (tEGFR, total EGFR). (B) Seventy-two hours later after cells were cultured in MEM with 5.5 mM glucose, tEGFR and pEGFR levels were both reduced by siRNA treatment compared with the control that was transfected with siRNA vector-expressing scrambled sequences. β-actin served as a loading control. (C) Compared with the control cells (there was no difference between non-transfected control cells and control siRNA vector transfected cells), AEE788 only caused a decrease in the proportion of cells in S phase (p < 0.01, arrowhead) with no detectable sub-G1 cells (dead cells). However, the EGFR siRNA-treated cells showed a significant (p < 0.01) proportion of sub-G1 cells (arrow).
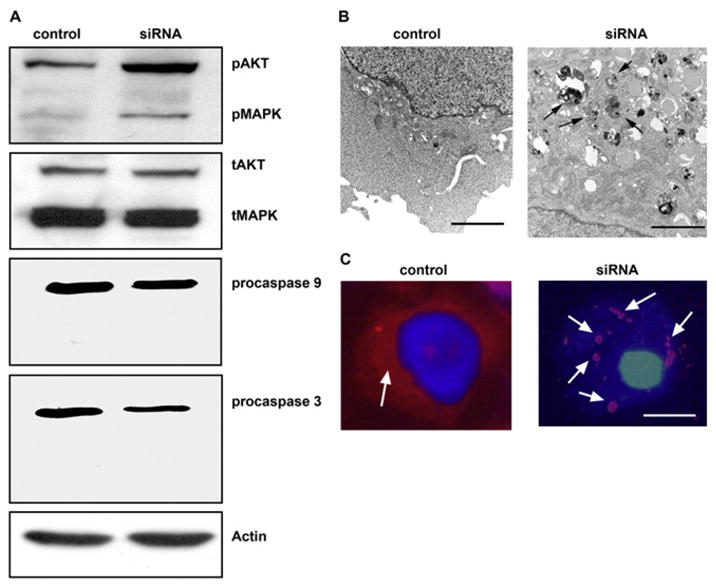
(A) Western blot analysis of the activity of Akt, MAPK, and caspases 9 and 3 in EGFR siRNA-treated cells. Both Akt and MAPK pathways were more active in siRNA-treated cells than in control cells, as indicated by the upregulation of phosphorylated Akt (pAkt) and MAPK (pMAPK); the total Akt (tAkt) and MAPK (tMAPK) were not changed. No cleaved form of caspase 9 or 3 was detected in the siRNA-treated cells; only their proforms (procaspase 9 and 3) were present, indicating that the cell death caused by knocking down EGFR was not a typical apoptosis. β-actin served as a loading control. (B) Transmission electron microscopy of control and EGFR siRNA-treated cells. Knocking down EGFR resulted in the appearance of autophagosomes (arrows) in the cytoplasm, which were absent from the control cells. (N, nucleus; bar, 200 nm). (C) LC3 staining (arrow, red color) in control and EGFR siRNA-transfected cells. Note that in the cytoplasm of control cells LC3 is diffused, whereas LC3 is in aggregates in the EGFR-siRNA treated cells (arrows, red color; bar, 2 μm).
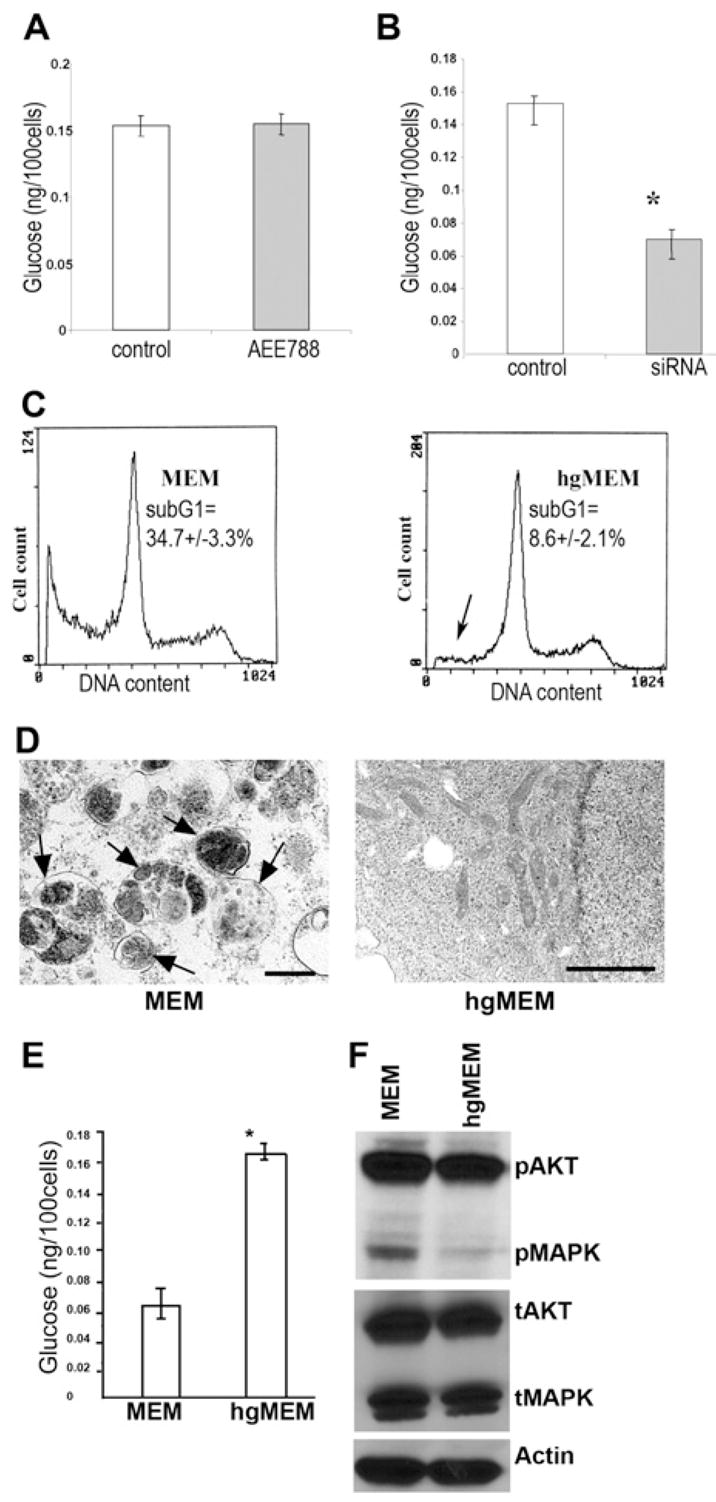
(A) Measurement of intracellular glucose content. AEE788 (5.0 μM) treatment for 72 hr did not alter the intracellular glucose content. (Error bars indicate mean ± SD.) (B) The glucose content of EGFR siRNA-treated cells was significantly decreased (p < 0.001) compared with that of control cells after a 72 hr culture in MEM with 5.5 mM glucose. (Triplicate samples were used in each group. The asterisk indicates a significant difference with p < 0.001. Error bars indicate mean ± SD.) (C) Culturing EGFR siRNA-transfected cells in high glucose (25 mM) MEM (hgMEM) significantly reduced (p < 0.01) the cell death proportion, as indicated by the decrease in sub-G1 cells (arrow). (Triplicate samples were used in this experiment.) (D)The hgMEM-treated cells also lead to disappearance of autophagosomes on transmission electron microscopy (bar, 2 μm). (E) The intracellular glucose level was also restored by hgMEM treatment. (Error bars indicate mean ± SD.) (F) Western blotting shows that hgMEM treatment was also able to inhibit the enhanced activation of AKT and MAPK induced by knocking down EGFR.
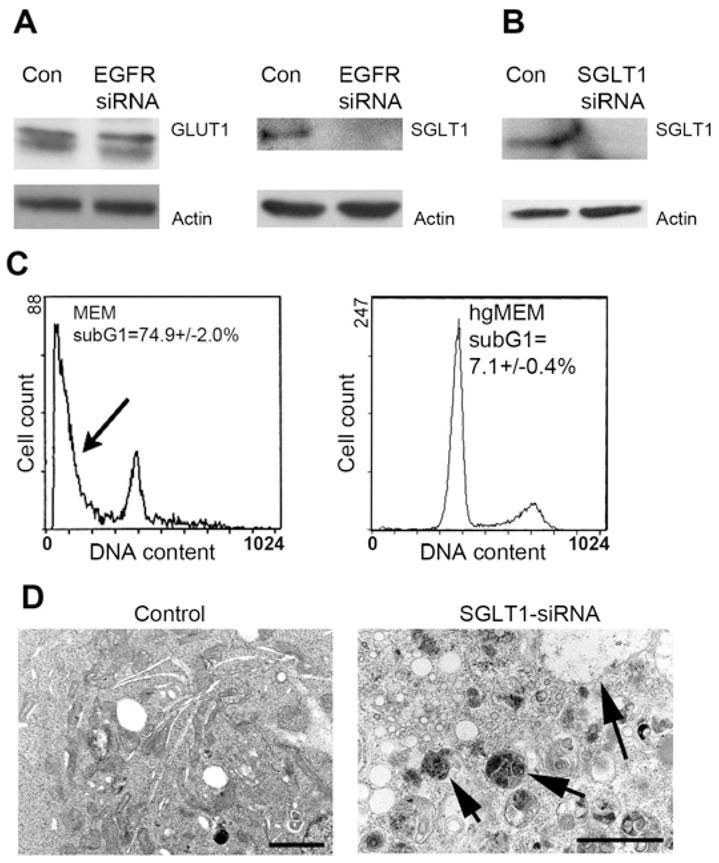
(A) No changes on GLUT1 expression were detected by knocking down EGFR, but SGLT1 was downregulated to an undetectable level. β-actin served as a loading control. (B) Cells treated with SGLT siRNA led to downregulation of SGLT1 after 4 days of culture in MEM. (C) This treatment also led to a significant proportion of cell deaths (p < 0.01) as evidenced by the presence of sub-G1 cells (arrow), and hgMEM was able to prevent cells from death. (The flow cytometry data of control vector-transfected cells were similar to those of the control cells used in the EGFR siRNA experiment in Figure 2.) (D) As with the EGFR siRNA-treated cells, cells that underwent SGLT1 siRNA treatment also showed a large amount of autophagosomes (arrows) on transmission electron microscopy (bar, 2 μm).
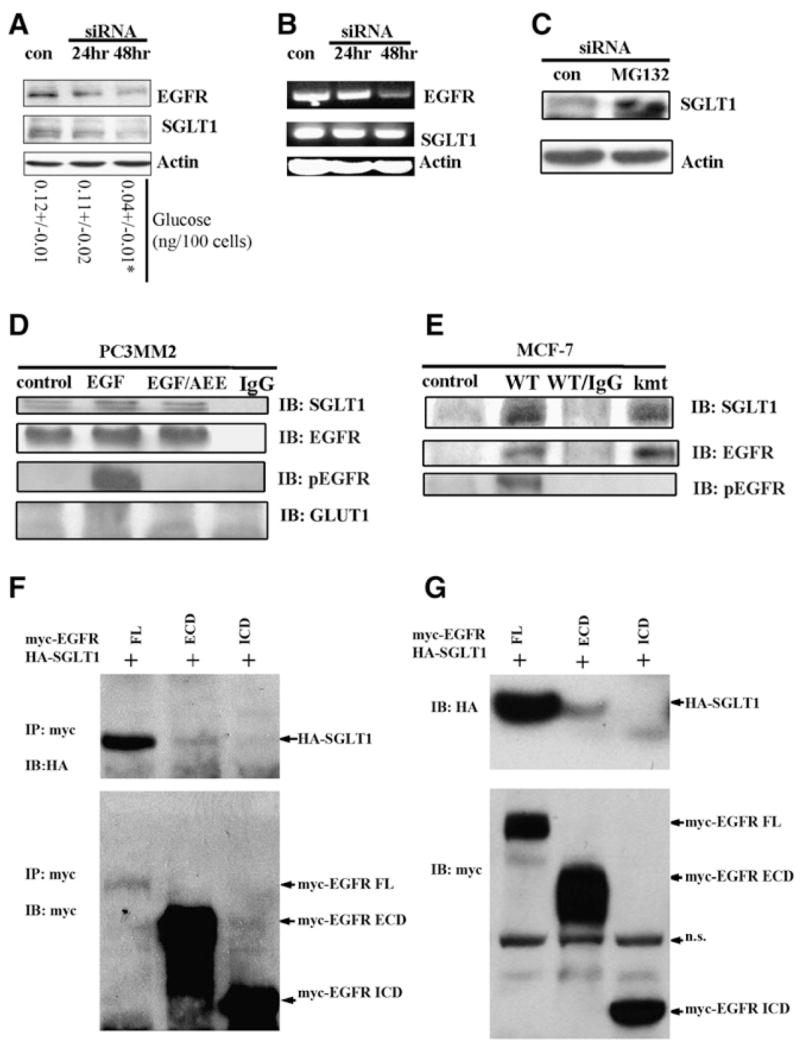
(A) Western blot revealed a time-dependent downregulation of SGLT1 by knocking down EGFR with siRNA (con, control). At each time point, levels of glucose were measured. *p < 0.05. (B) RT-PCR analysis of EGFR mRNA and SGLT1 mRNA in response to EGFR siRNA treatment (con, control). The EGFR mRNA became downregulated at 48 hr after EGFR siRNA treatment, whereas the SGLT1 mRNA level remained unchanged. (C) Proteasome inhibitor MG132 blocked the downregulation of SGLT1 by EGFR siRNA; siRNA and MG132 treatments were for 24 hr. Actin was used as an internal control. (D) EGFR physically interacted with SGLT1, independent of EGFR kinase activity, as revealed by coimmunoprecipitation with the anti-EGFR antibody C225. PC3MM2 cells were cultured in serum-free medium for 12 hr before being treated with 40 ng/ml EGF or with EGF and AEE788 (EGF/AEE). The blotting of immunoprecipitates was against SGLT1, total EGFR, pEGFR, and GLUT1. Normal mouse IgG was used as a negative control). (E) kmtEGFR also interacted with SGLT1 as did WT-EGFR in MCF-7 cells co-transfected with WT-EGFR/SGLT1 or kmtEGFR/SGLT1. (F) HA-SGLT1 was coimmunoprecipitated with myc-EGFR and myc-ECD, but not myc-ICD. (G) Western blotting detection of HA-SGLT1 coexpressed with myc-tagged full-length (FL), the extracellular domain (ECD containing the transmembrane domain), and intracellular domain (ICD) of EGFR in HEK293 cells. Note that HA-SGLT1 was only efficiently coexpressed with full-length EGFR, to much less extent with ECD, but not with ICD of EGFR (IP, immunoprecipitation; IB, immunoblotting; n.s., nonspecific band).
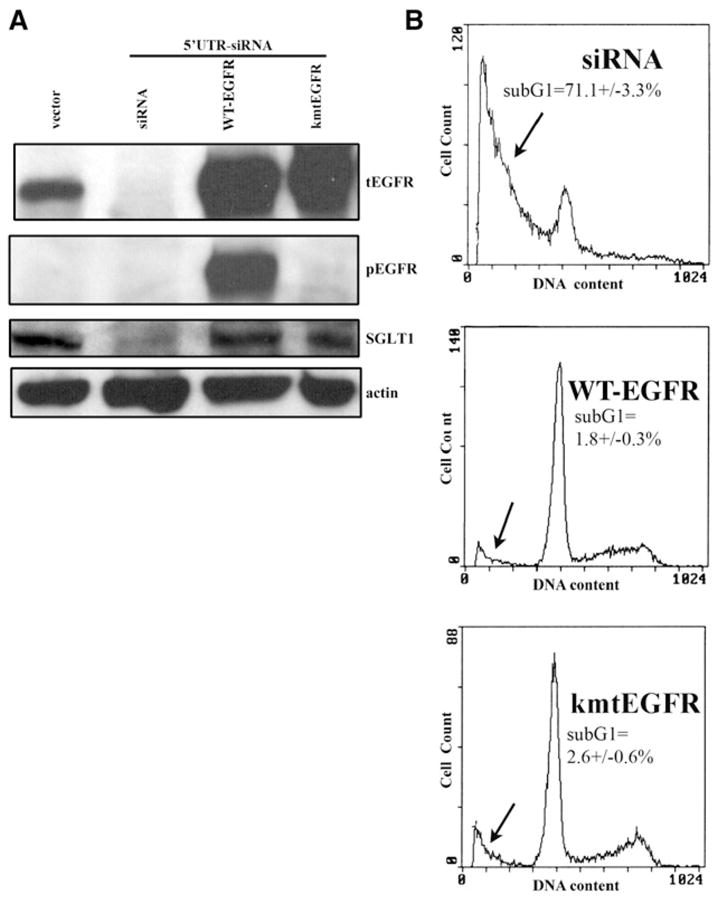
(A) PC-3MM2 cells were treated with siRNA targeting the 5′UTR region of EGFR mRNA, which downregulated the EGFR level after a 4-day siRNA treatment. Both WT-EGFR and kmtEGFR were re-expressed in the siRNA-treated cells and were able to upregulate SGLT1 expression. The absence of kinase activity of kmtEGFR was shown by western blotting with an anti-pEGFR antibody. β-actin served as a loading control. (B) The re-expression of WT-EGFR and kmtEGFR also rescued the EGFR siRNA-treated cells from death. The sub-G1 proportion is indicated by the arrows. (Duplicate samples were used in each group of samples.)
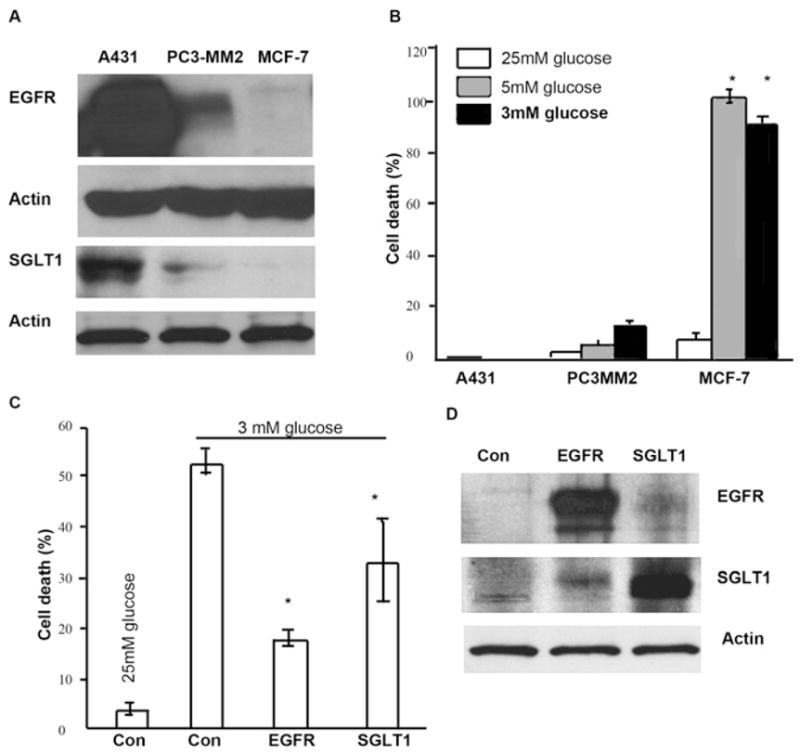
(A) Western Blotting analysis demonstrated that SGLT1 was expressed in EGFR-positive cells, A431 and PC3-MM2, but not in MCF-7. (B) When A431, PC3-MM2, and MCF-7 cells were cultured in media containing different levels of glucose, 25 mM, 5 mM, and 3 mM, for 3 days, only MCF-7 cells showed significant degree of cell death. (Error bars indicate mean ± SD.) (C and D) Either EGFR or SGLT1 was transiently expressed in MCF-7 cells cultured in 25 mM containing MEM. Forty-eight hours later after the transfection, medium was changed to MEM containing 3 mM glucose. After a 2 day incubation in low glucose MEM, cells were either fixed for cell death analysis by flow cytometry (C) or harvested for western blotting analysis of EGFR and SGLT1 (D). (Triplicate samples were used in each group of samples. Asterisks represent statistical significance as compared with cells grown in high glucose [25 mM] medium, p < 0.05. Error bars indicate mean ± SD.)
Comment in
-
A sweet new role for EGFR in cancer.Cancer Cell. 2008 May;13(5):375-6. doi: 10.1016/j.ccr.2008.04.008. Cancer Cell. 2008. PMID: 18455118
References
-
- Arteaga CL. Epidermal growth factor receptor dependence in human tumors: More than just expression? Oncologist. 2002;7 (Suppl 4):31–39. - PubMed
-
- Chan C, Gill GN. Mutational analysis of the nucleotide binding site of the epidermal growth factor receptor and v-Src protein-tyrosine kinases. J Biol Chem. 1996;271:22619–22623. - PubMed
-
- Cohen EE, Rosen F, Stadler WM, Recant W, Stenson K, Huo D, Vokes EE. Phase II trial of ZD1839 in recurrent or metastatic squamous cell carcinoma of the head and neck. J Clin Oncol. 2003;21:1980–1987. - PubMed
Publication types
MeSH terms
Substances
Grants and funding
LinkOut - more resources
Full Text Sources
Other Literature Sources
Molecular Biology Databases
Research Materials
Miscellaneous
