. 2008 Jun 23;154(2):482-95.
doi: 10.1016/j.neuroscience.2008.03.046. Epub 2008 Mar 29.

The modulation of voltage-gated potassium channels by anisotonicity in trigeminal ganglion neurons

Affiliations

The modulation of voltage-gated potassium channels by anisotonicity in trigeminal ganglion neurons

L Chen et al. Neuroscience. .

Abstract

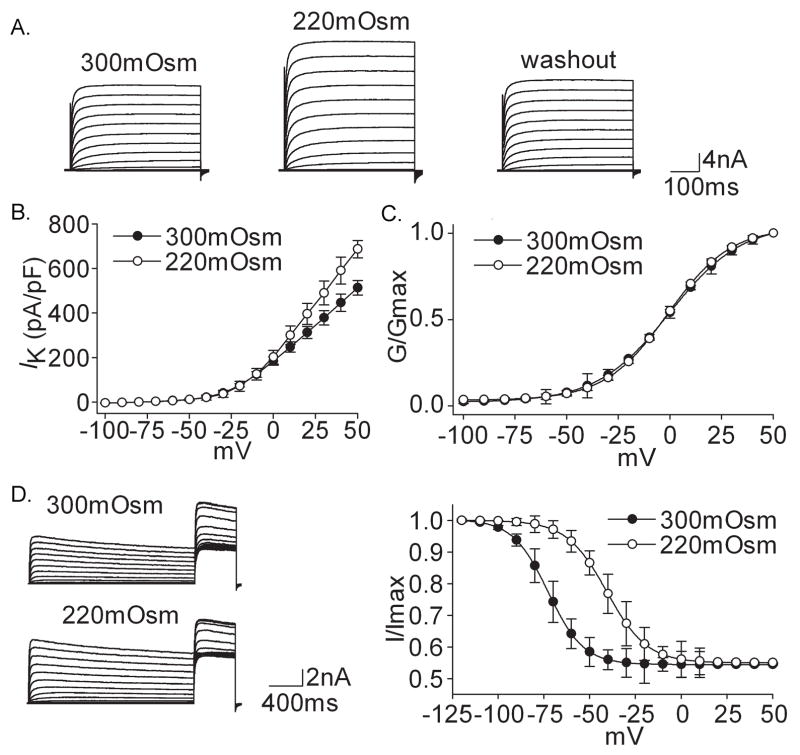
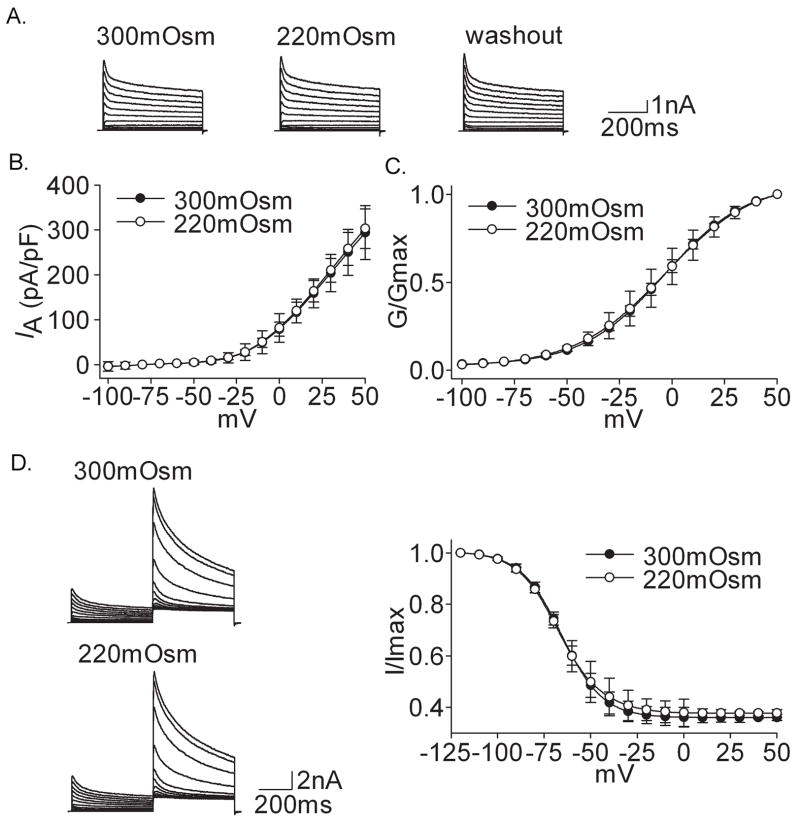
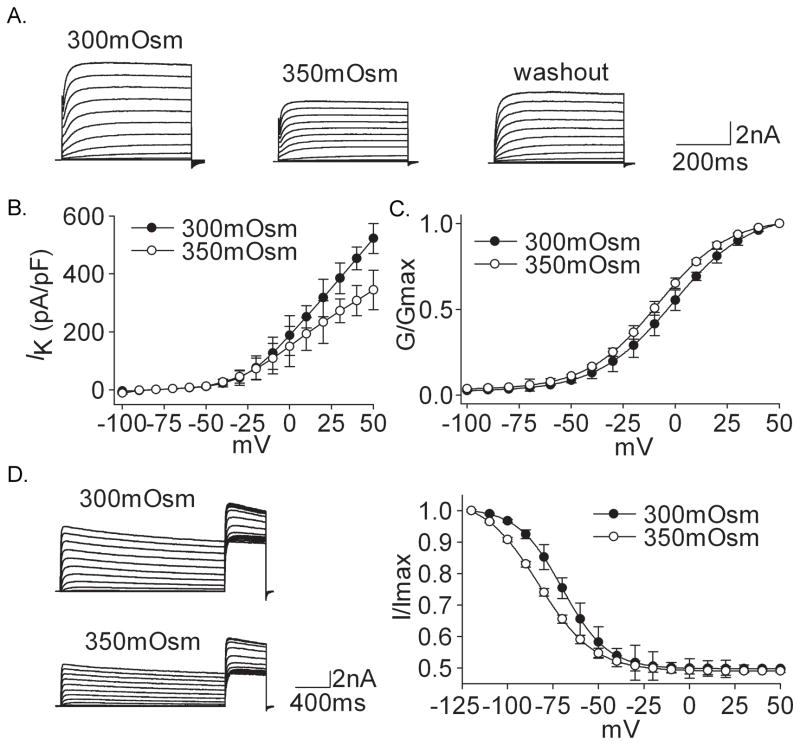
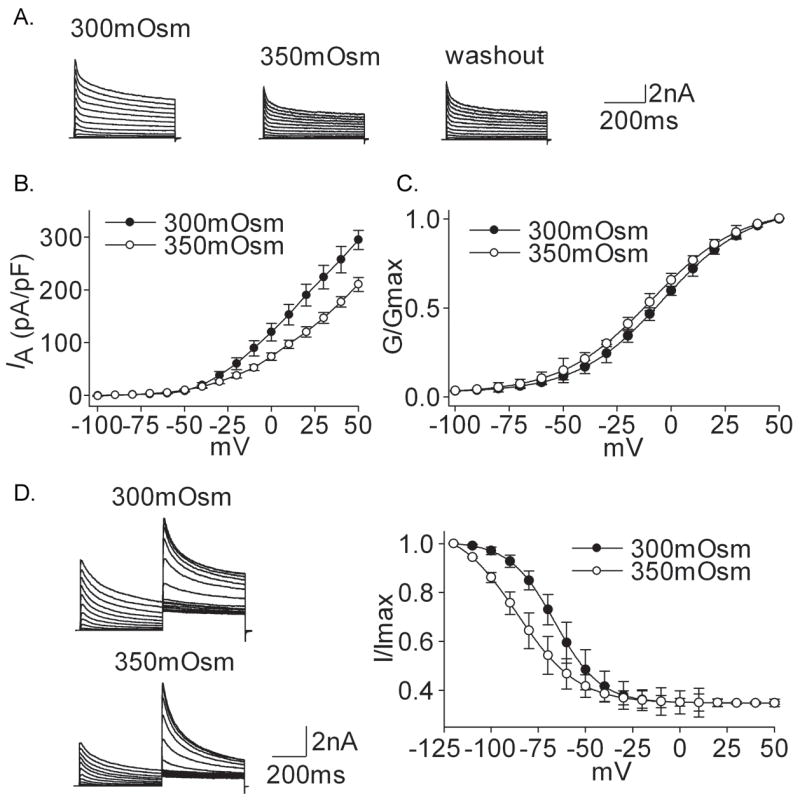
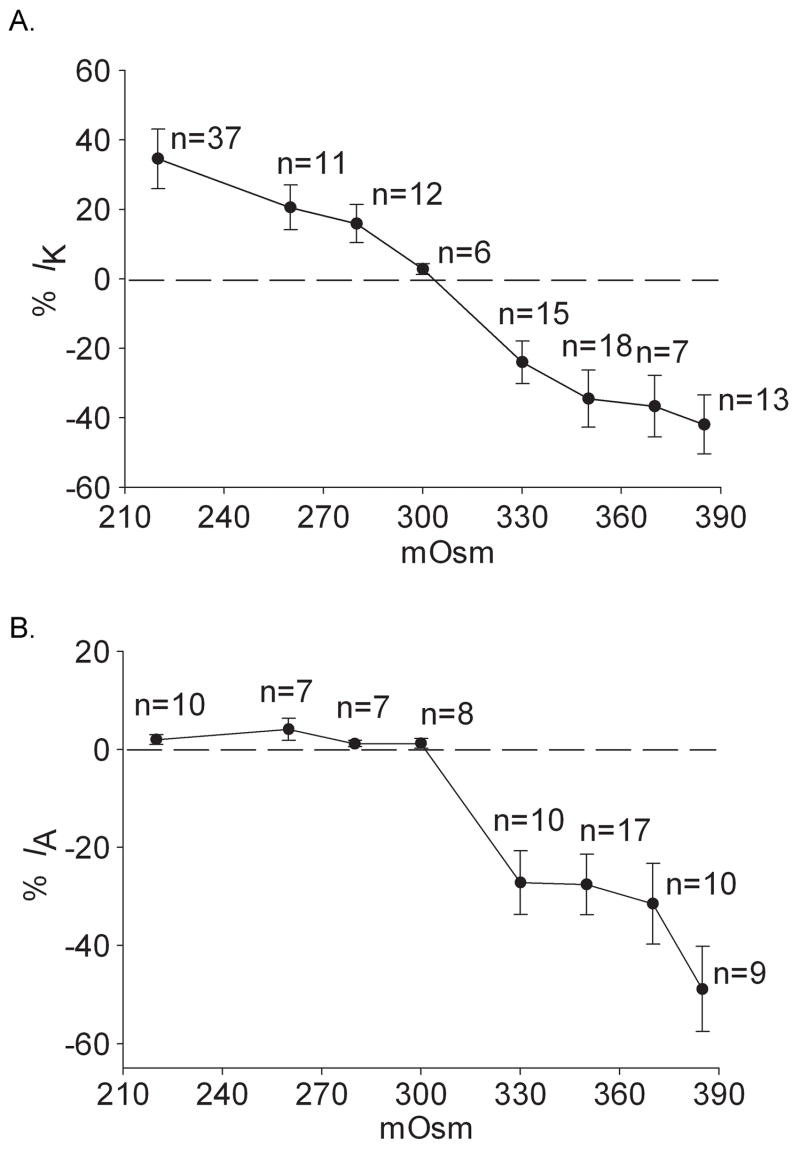
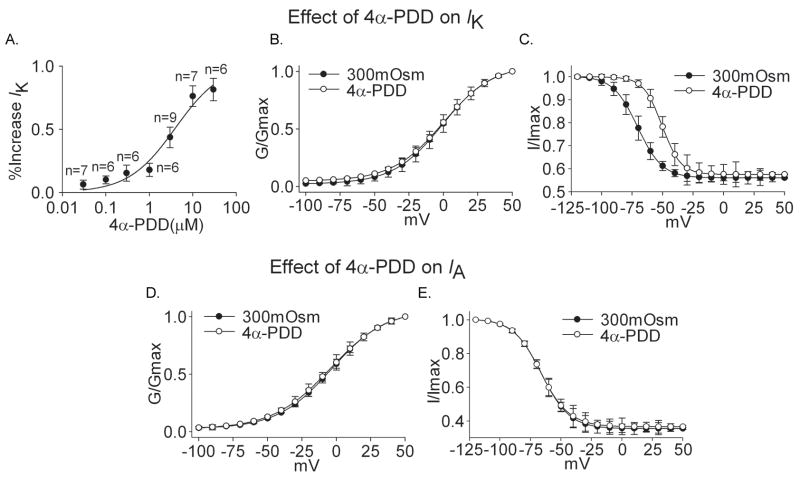
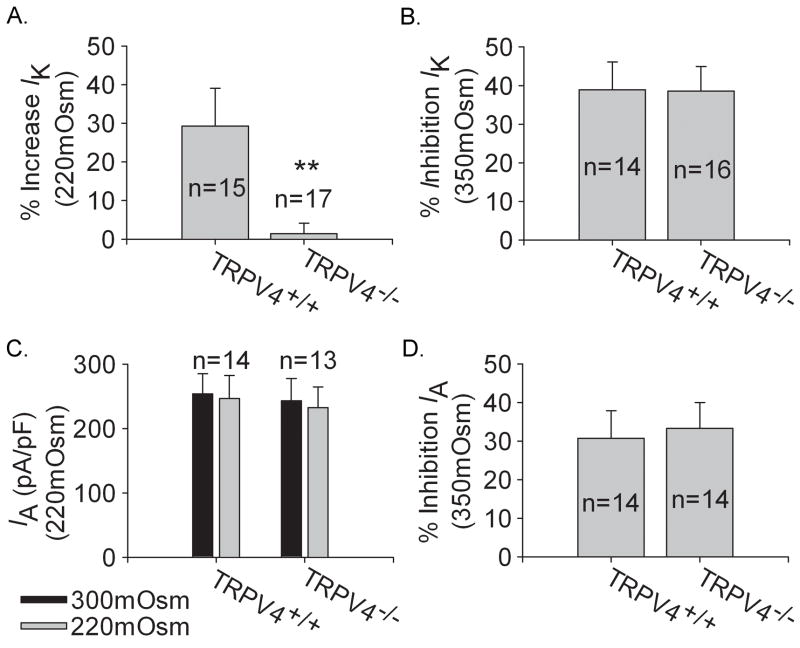
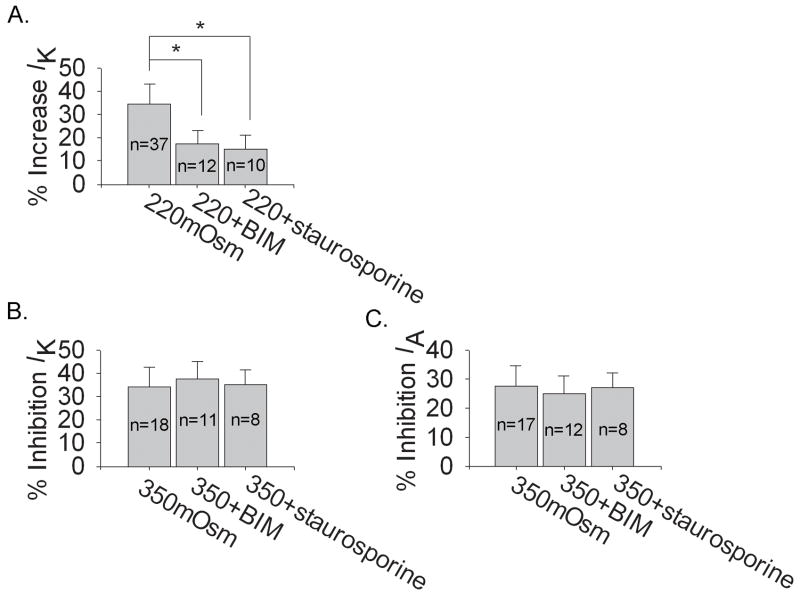
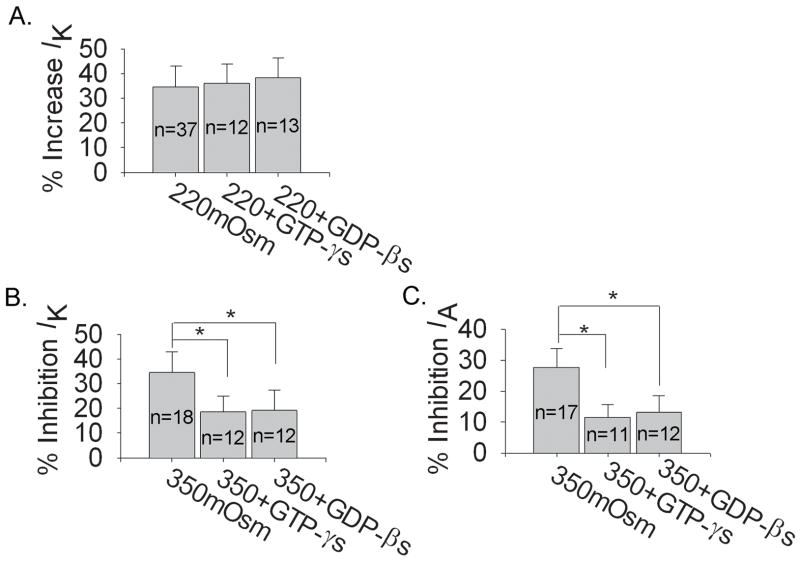
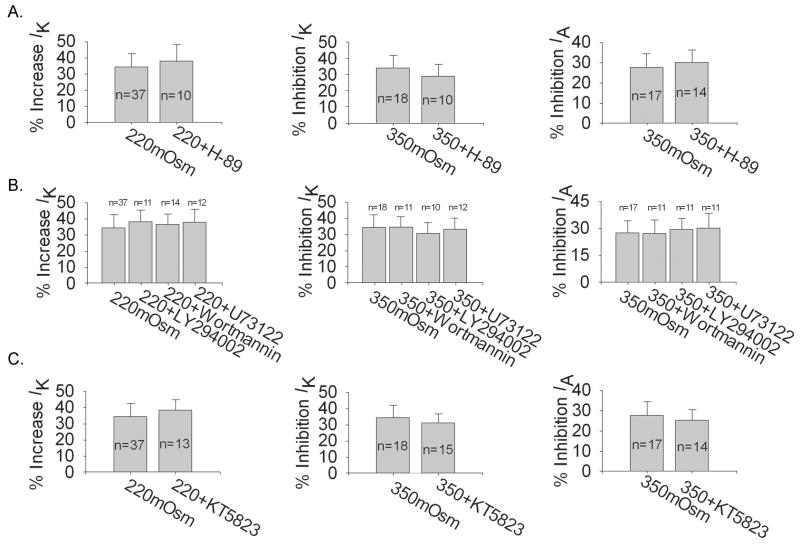
Voltage-gated potassium channels (VGPCs) play an important role in many physiological functions by controlling the electrical properties and excitability of cells. Changes in tonicity in the peripheral nervous system can activate nociceptors and produce pain. Here, using whole cell patch clamp techniques, we explore how hypo- and hypertonicity modulate VGPCs in cultured rat and mouse trigeminal ganglion (TG) neurons. We found that hypo- and hypertonicity had different effects on slow-inactivating K+ current (IK) and fast-inactivating K+ current (IA): hypotonicity increased IK but had no effect on IA while hypertonicity depressed both IK and IA. The increase of IK by hypotonicity was mimicked by transient receptor potential vanilloid 4 (TRPV4) receptor activator 4alpha-phorbol-12,13-didecanoate (4alpha-PDD) but hypotonicity did not exhibit increase in TRPV4-/- mice TG neurons, suggesting that TRPV4 receptor was involved in hypotonicity-induced response. We also found that inactivation of PKC selectively reversed the increase of IK by hypotonicity, whereas antagonism of G-protein selectively rescued the inhibitions of IK and IA by hypertonicity, indicating that different intracellular signaling pathways were required for the modulation by hypo- and hypertonicity. In summary, changes in osmolality have various effects on IK and IA and different receptors and second messenger systems are selective for the modulation of VGPCs induced by hypo- versus hypertonicity.


Figures

Figure 1
Figure 1. Effect of hypotonicity on IK
A. The typical recordings show that IK, evoked by voltage step to +50 mV, was increased from 4.57 nA to 6.38 nA when the external solution was changed from 300mOsm to 220mOsm for 3min and the current recovered to 4.77 nA after washout. B. The peak current-voltage relationship (I–V) was shown before and during hypotonicity treatment. C. In the presence of hypotonicity, G–V curve did not shift significantly. V0.5 was −0.93±1.30 mV and −0.90±0.71 mV (n=8, paired t test, P>0.05) for 300mOsm and 220mOsm, respectively; k was 16.46±1.13 and 16.07±0.41 (n=8, paired t test, P>0.05), respectively. Data were transformed from the I–V data shown in B. D. The typical recordings show that hypotonicity increased IK and inactivation–voltage curve significantly shifted to depolarizing direction. V0.5 was −72.67±1.54 mV and −40.55±5.25 mV (n=8, paired t test, P<0.05) for 300mOsm and 220mOsm, respectively; k was −9.67±1.32 and −10.98±4.61 (n=8, paired t test, P>0.05), respectively.
Figure 2
Figure 2. Effect of hypotonicity on IA
A. After exposure to hypotonicity (220mOsm), IA was not affected and the peak amplitude was 5.87 nA, 5.91 nA and 5.93 nA before, during and after hypotonicity application, respectively. B. I–V curve did not change before and during hypotonicity treatment. C. G–V curve did not shift in the presence of hypotonicity. V0.5 was −3.57±0.18 mV and −3.33±0.72 mV (n=11, paired t test, P>0.05) for 300mOsm and 220mOsm, respectively; k was 19.47±1.20 and 21.08±0.75 (n=11, paired t test, P>0.05), respectively. Data were transformed from the I–V data shown in B. D. Hypotonicity had no effect on inactivation–voltage curve. V0.5 was −68.47±0.23 mV and −69.42±0.21 mV (n=11, paired t test, P>0.05) for 300mOsm and 220mOsm, respectively; k was −9.37±0.20 and −9.67±0.15 (n=11, paired t test, P>0.05), respectively.
Figure 3
Figure 3. Effect of hypertonicity on IK
A. The typical recordings show that IK was reduced from 8.16 nA to 5.32 nA when the external solution was changed from 300mOsm to 350mOsm for 3 min but the current recovered only slightly (5.84 nA) after washout. B. I–V curve was shown before and during hypertonicity treatment. C. In the hypertonic solution G–V curve shifted to the hyperpolarization direction. V0.5 was −0.92±1.23 mV and −8.16±1.02 mV (n=11, paired t test, P<0.05) for 300mOsm and 350mOsm, respectively; k was 18.13±1.08 and 17.63±0.95 (n=11, paired t test, P>0.05), respectively. Data were transformed from the I–V data shown in B. D. The typical recordings show that the amplitude of IK was reduced in the presence of hypertonic solution and inactivation–voltage curve shifted to hyperpolarizing direction with V0.5 being −69.99±1.48 mV and −83.00±1.22 mV (n=12, paired t test, P<0.05) for 300mOsm and 350mOsm, respectively; k being −11.68±1.28 and −15.19±0.87 (n=12, paired t test, P<0.05), respectively.
Figure 4
Figure 4. Effect of hypertonicity on IA
A. The typical recordings show that IA was reduced from 8.34 nA to 6.01 nA when the external solution was changed from 300mOsm to 350mOsm but the current almost did not recover (6.75 nA) after washout. B. I–V curve was shown before and during hypertonicity treatment. C. In the hypertonic solution G–V curve shifted to the hyperpolarization direction. V0.5 was −3.98±0.25 mV and −9.43±0.99 mV (n=10, paired t test, P<0.05) for 300mOsm and 350mOsm, respectively; k was 19.16±0.81 and 20.38±0.94 (n=11, paired t test, P>0.05), respectively. Data were transformed from the I–V data shown in B. D. The typical recordings show that the amplitude of IA was inhibited upon exposure to hypertonic stimulus and inactivation–voltage curve shifted to the hyperpolarizing direction. V0.5 was −69.45±0.27 mV and −86.32±0.47 mV (n=12, paired t test, P<0.05) for 300mOsm and 350mOsm, respectively; k was −9.93±0.24 and −16.37±0.28 (n=10, paired t test, P<0.05), respectively.
Figure 5
Figure 5. Effect of anisotonicity on IK and IA
A. IK was enhanced by hypotonic stimuli and inhibited by hypertonic stimuli. B. IA was not significantly affected when exposed to hypotonicity but inhibited by hypertonic stimuli.
Figure 6
Figure 6. Effect of 4α-PDD on IK and IA
A. The plot shows the percentage in increase of IK by 4α-PDD at concentrations of 0.03, 0.1, 0.3, 1.0, 3.0, 10 and 30 μM. The dose–response curve fits to Hill equation with IC50 being 4.01 μM and n being 0.80. B. G–V curve of IK did not shift upon exposed to 3.0 μM4α-PDD. V0.5 was −0.58±0.60 mV and −0.11±0.48 mV (n=9, paired t test, P>0.05) before and during 4α-PDD treatment, respectively; k was 17.83±0.53 and 18.38±0.42 (n=9, paired t test, p>0.05), respectively. C. After application of 3.0 μM 4α-PDD, inactivation–voltage curve of IK significantly shifted to the depolarizing direction. V0.5 was −70.44±0.10 mV and −50.40±0.42 mV (n=9, paired t test, P<0.05) before and during 4α-PDD treatment, respectively; k was −10.08±0.08 and −7.60±0.36 (n=9, paired t test, P<0.05), respectively. D. Application of 3.0 μM 4α-PDD had no effect on G–V curve of IA (300mOsm: V0.5=−3.46±0.17 mV, k=19.62±0.15; 4α-PDD: V0.5=−4.42±0.25 mV, k=20.80±0.23, n=8, paired t test, P>0.05). E. Application of 4α-PDD had no effect on inactivation–voltage curve of IA either (300mOsm: V0.5=−65.93±0.29 mV, k=−11.49±0.25; 4α-PDD: V0.5=−66.38±0.74 mV, k=−11.58±0.65, n=8, paired t test, P>0.05).
Figure 7
Figure 7. Effects of anisotonicity on IK and IA in TG neurons from TRPV4+/+ and TRPV4−/− mice
A. Upon exposure to hypotonicity (220mOsm), IK was increased by 29.21±9.81% (n=15) in TRPV4+/+ mice TG neurons, which was significantly different from that in TRPV4−/− mice (1.41±2.72%, n=17) (unpaired t test, P<0.01). B. After exposure to hypotonicity (220mOsm), IA was not significantly affected. On the average, in TRPV4+/+ mice TG neurons, the amplitude was 253.75±31.43 pA/pF and 243.19±33.99 pA/pF (n=14, paired t test, P>0.05) before and during hypotonicity treatment, respectively, and in TRPV4−/− mice TG neurons IA was 246.42±35.52 pA/pF and 232.13±32.58 pA/pF (n=13, paired t test, P>0.05), respectively. C. After exposure to hypertonicity (350mOsm), IK was reduced by 38.82±7.25% (n=14) and 38.52±6.38% (n=16) in TRPV4+/+ and TRPV4−/− TG neurons respectively (unpaired t test, P>0.05). D. After exposure to hypertonicity (350mOsm), the inhibition of IA by hypertonicity was 30.68±7.16% (n=14) and 33.31±6.61% (n=14) in TRPV4+/+ and TRPV4−/− mice TG neurons respectively (unpaired t test, P>0.05).
Figure 8
Figure 8. Modulation of PKC system on the effects induced by hypo and hypertonicity
A. Pre-incubation with PKC antagonists, BIM and staurosporine, significantly reversed the increase of IK by hypotonicity from 34.52±8.58% to 17.48±5.59% (n=12) (unpaired t test, P<0.05) and 15.11±6.17% (n=10) (unpaired t test, P<0.05) respectively. B. Neither BIM nor staurosporine statistically affected the inhibitions of VGPCs by hypertonicity (unpaired t test, P>0.05). In the presence of BIM and staurosporine, IK was inhibited by 37.88±7.38% (n=11) and 35.43±6.01% (n=8), respectively and IA by 25.03±6.12% (n=12) and 27.13±5.05% (n=8), respectively.
Figure 9
Figure 9. Modulation of G-protein system on the effects induced by hypo and hypertonicity
A. Neither GTP-γs nor GDP-βs had significant effect on the increase of IK by hypotonicity (unpaired t test, P>0.05). In hypotonic solution (220mOsm) IK was enhanced by 36.00±7.91% (n=12) and 38.23±8.01% (n=13) with GTP-γs and GDP-βs in the pipette solution, respectively. B. Both GTP-γs and GDP-βs markedly reversed the inhibitions of IK (unpaired t test, P<0.05) and IA (unpaired t test, P<0.05) by hypertonicity. In hypertonic solution (330mOsm) IK was reduced by 18.73±5.90% (n=12) and 19.29±8.02% (n=12) in the presence of GTP-γs and GDP-βs, respectively and IA by 11.53±4.19% (n=11) and 13.17±5.26% (n=12), respectively.
Figure 10
Figure 10. Modulation of PKA, lipid cascade and PKG systems on the effects induced by hypo and hypertonicity
A. For PKA system, pre-incubation with PKA inhibitor, H-89, had no significant effect on the modulations of VGPCs by hypo or hypertonicity (unpaired t test, P>0.05). In the presence of 10 μM H-89, IK was increased 38.04±8.64% (n=10) by hypotonicity, while IK and IA were decreased 29.46±7.68% (n=10) and 30.00±6.64% (n=14) by hypertonicity respectively. B. For lipids cascade, in hypotonic solution, IK was increased by 38.32±7.62% (n=11), 36.61±6.83% (n=14) and 37.86±8.59% (n=12) with Wortmannin, LY294002 and U73122 in the pipette solution, respectively. Compared with the inhibition of hypotonicity with normal pipette solution (34.52±8.58%, n=37), none of them was significantly different (unpaired t test, P>0.05). Similarly, pre-incubation with Wortmannin, LY294002 and U73122 did not affect the inhibition of IK or IA by hypertonicity (unpaired t test, P<0.05). In the presence of Wortmannin, LY294002 and U73122, the inhibition of IK by hypertonicity was 34.71±6.72% (n=11), 30.73±7.29% (n=10) and 33.23±7.55% (n=12) respectively and the inhibition of IA was 27.25±8.02% (n=11), 29.50±6.61% (n=11) and 30.16±8.79% (n=11) respectively. C. For PKG system, KT5823 did not statistically alter the modulation of VGPCs by hypo or hypertonicity (unpaired t test, P>0.05). In the presence of KT5823, IK was increased 38.33±7.15% (n=13) by hypotonicity, while IK and IA were inhibited 31.12±6.12% (n=15) and 25.17±5.67% (n=14) by hypertonicity, respectively.

Similar articles

Cited by

References

    1. Akins PT, McCleskey EW. Characterization of potassium currents in adult rat sensory neurons and modulation by opioids and cyclic AMP. Neuroscience. 1993;56:759–769. - PubMed
    1. Alessandri-Haber N, Dina OA, Joseph EK, Reichling D, Levine JD. A transient receptor potential vanilloid 4-dependent mechanism of hyperalgesia is engaged by concerted action of inflammatory mediators. J Neurosci. 2006;26:3864–3874. - PMC - PubMed
    1. Alessandri-Haber N, Dina OA, Yeh JJ, Parada CA, Reichling DB, Levine JD. Transient receptor potential vanilloid 4 is essential in chemotherapy-induced neuropathic pain in the rat. J Neurosci. 2004;24:4444–4452. - PMC - PubMed
    1. Alessandri-Haber N, Joseph E, Dina OA, Liedtke W, Levine JD. TRPV4 mediates pain-related behavior induced by mild hypertonic stimuli in the presence of inflammatory mediator. Pain. 2005;118:70–79. - PubMed
    1. Alessandri-Haber N, Yeh JJ, Boyd AE, Parada CA, Chen X, Reichling DB, Levine JD. Hypotonicity induces TRPV4-mediated nociception in rat. Neuron. 2003;39:497–511. - PubMed

Publication types

MeSH terms