Case Reports
. 2008 Jul;295(1):H48-58.
doi: 10.1152/ajpheart.91495.2007. Epub 2008 May 2.

Subepicardial phase 0 block and discontinuous transmural conduction underlie right precordial ST-segment elevation by a SCN5A loss-of-function mutation

Affiliations
Case Reports

Subepicardial phase 0 block and discontinuous transmural conduction underlie right precordial ST-segment elevation by a SCN5A loss-of-function mutation

Markéta Bébarová et al. Am J Physiol Heart Circ Physiol. 2008 Jul.

Abstract

Two mechanisms are generally proposed to explain right precordial ST-segment elevation in Brugada syndrome: 1) right ventricular (RV) subepicardial action potential shortening and/or loss of dome causing transmural dispersion of repolarization; and 2) RV conduction delay. Here we report novel mechanistic insights into ST-segment elevation associated with a Na(+) current (I(Na)) loss-of-function mutation from studies in a Dutch kindred with the COOH-terminal SCN5A variant p.Phe2004Leu. The proband, a man, experienced syncope at age 22 yr and had coved-type ST-segment elevations in ECG leads V1 and V2 and negative T waves in V2. Peak and persistent mutant I(Na) were significantly decreased. I(Na) closed-state inactivation was increased, slow inactivation accelerated, and recovery from inactivation delayed. Computer-simulated I(Na)-dependent excitation was decremental from endo- to epicardium at cycle length 1,000 ms, not at cycle length 300 ms. Propagation was discontinuous across the midmyocardial to epicardial transition region, exhibiting a long local delay due to phase 0 block. Beyond this region, axial excitatory current was provided by phase 2 (dome) of the M-cell action potentials and depended on L-type Ca(2+) current ("phase 2 conduction"). These results explain right precordial ST-segment elevation on the basis of RV transmural gradients of membrane potentials during early repolarization caused by discontinuous conduction. The late slow-upstroke action potentials at the subepicardium produce T-wave inversion in the computed ECG waveform, in line with the clinical ECG.


Figures

Fig. 1.
Fig. 1.
Clinical and genetic characterization. A: accentuated J waves and negative T waves in ECG lead V2, and ST-segment elevation in V3 on the proband's ECG at baseline. Coved-type ST-segment elevation in V2 after administration of flecainide (100 mg iv) is shown. B: sequence analysis revealed a heterozygous missense mutation p.Phe2004Leu. C: schematic localization of the mutation in the COOH-terminus of the Na+ channel. D: pedigree and ECG recordings in proband's father at baseline and during provocation testing with ajmaline (80 mg iv). WT, wild type.
Fig. 2.
Fig. 2.
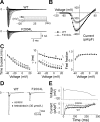
Biophysical characterization of F2004L channels. A: representative whole cell recordings of Na+ current (INa), WT vs. F2004L. B: averaged current-voltage relationships illustrating the 46% decrease of peak-activating INa in mutant channels (n = 16 and 17 cells for WT and F2004L, respectively). C: voltage dependence of the time course of INa. Left: time to peak was delayed in F2004L channels for depolarizations from −25 to +15 mV. Middle: fast-phase time constant (τf) of fast inactivation was decelerated in F2004L channels between −30 and +20 mV. *P < 0.05, †P < 0.01, and ‡P < 0.001. Slow-phase time constant (τs) of fast inactivation was similar for mutant and WT INa. Right: fraction of channels that inactivated with τf was not different. D: sensitivity of peak INa to 30 μmol/l tetrodotoxin was similar in F2004L (n = 4 cells) and WT channels (n = 5 cells): 90 ± 3 vs. 84 ± 4% block (P = not significant). E: late tetrodotoxin-sensitive INa during action potential clamp was 41% lower in the mutant INa. Averaged traces are from 4 F2004L and 5 WT cells.
Fig. 3.
Fig. 3.
Voltage dependence of INa steady-state activation and inactivation and development of closed-state and slow inactivation. A: voltage dependence of steady-state activation (protocol as in Fig. 2A) and inactivation. Curves were fitted with a Boltzmann equation, G/Gmax = 1/[1 + exp(V1/2V)/k], to determine the membrane potential for half-maximal activation or inactivation (V1/2) and slope factor (k), where G is Na+ conductance, Gmax is maximal G, I is peak INa during depolarizing step, and Imax is maximal I. For steady-state activation, V1/2 was similar in mutant and WT, whereas k was higher in F2004L channels. Voltage dependence of steady-state inactivation of F2004L channels was shifted to the negative direction by ∼7.5 mV and was less steep. Data are from n = 14 and 15 cells for F2004L and WT, respectively. B: closed-state inactivation. Averaged data were fitted with a single-exponential function I/Imax = A × [1 − exp(−t/τ)] to determine amplitude A and time constant τ. The temporal development of closed-state inactivation was not different between F2004L and WT channels (n = 15 and 16 cells, respectively). However, the fraction of channels entering this state was higher in the mutant condition. C: the development of slow inactivation was accelerated in F2004L channels. Same fitting as in B; n = 7 and 4 cells for F2004L and WT, respectively. *P < 0.05, †P < 0.01, and ‡P < 0.001.
Fig. 4.
Fig. 4.
Recovery from inactivation. A, left: representative examples for mutant and WT INa. Right: averaged data of I/Imax for F2004L and WT; n cell values are indicated in Table 1. Data were fitted with a double-exponential function I/Imax = Af × [1 − exp(−trec,f)] + As × [1 − exp(−trec,s)], where Af and As are the fractions of fast and slow recovering components, τrec,f and τrec,s are their time constants, and t is recovery interval. At holding potential −120 mV, τrec,f was significantly longer in F2004L channels. B: recovery from inactivation at various holding potentials. Compared with −120 mV, recovery was slower at more depolarized holding potentials, although still different between the two conditions. The τrec,s was not different. *P < 0.05 and †P < 0.01.
Fig. 5.
Fig. 5.
Model schematic. A: WT and F2004L INa models share the same structure. C, closed state; IC, inactivated-closed state; O, open (conducting) state; IF, fast inactivation state; IM, intermediate inactivation state; α and β are transition rates between states. Transition rate increases and decreases in the mutant relative to the WT model are represented as thick solid or thin dashed arrows, respectively. B: INa models were incorporated into the Luo-Rudy (LRd) ventricular cell model. C: a one-dimensional model containing 165 LRd cells connected through gap junctions was used to simulate transmural RV conduction and compute pseudo-ECG waveforms.
Fig. 6.
Fig. 6.
Discontinuous transmural conduction with F2004L INa at slow pacing rate. A: the 10th action potential at cycle lengths (CL) of 300 and 1,000 ms is shown for WT INa (top), F2004L INa (middle), and F2004L INa with 50% ITO conductance (50% GTO, bottom). Action potentials are normal, and propagation is continuous and uniform for WT at both fast and slow rates. Conduction velocity is 45.3 and 44.4 cm/s, respectively. For F2004L, conduction is slowed (25.2 cm/s) at CL 300 ms, but continuous. However, at CL 1,000 ms, there is a long delay of 116.5 ms before the excitation of cell 150. Black lines show action potentials of every fifth cell between cells 115 and 150. When GTO is 50% reduced, this delay is eliminated. B: surface plot showing action potentials in space and time for the F2004L fiber. The excitation wave is decremental and encounters a long delay beyond the midmyocardial (M)-cell-to-epicardial (epi)-cell transition region. The delayed action potentials have very slow upstrokes. Note that the dome of a M-cell action potential is of higher magnitude than its peak phase 0 upstroke and, therefore, generates a greater driving force for downstream axial current (Iaxial). C: conduction velocity is rate independent for WT, but is reduced in a rate-dependent manner for F2004L. For F2004L with 50% GTO, it is reduced and relatively rate independent. D: Iaxial for cells along the F2004L fiber at CL 1,000 ms. Both peak inward (negative) and outward (positive) Iaxial decrease with cell number along the fiber, indicating that, as propagation proceeds, cells receive less depolarizing current from upstream neighbors and give less depolarizing current to downstream neighbors. Of the cells shown, cell 150 (red) is excited after a long delay. The initial Iaxial influx is too small to excite this cell, but a later influx supported by phase 2 (dome) of excited upstream cells is sufficient to cause excitation. This dome-driven current appears as late outward deflections in Iaxial for epi cells 120 (blue) and 135 (green). Vm, membrane potential. endo, Endocardial.
Fig. 7.
Fig. 7.
Mechanism underlying the F2004L conduction delay at CL 1,000 ms and its pseudo-ECG manifestation. A: cells 15 (endo), 80 (M), and 150 (epi) represent three important behaviors. Both inward and outward Iaxial are large for cells 15 and 80. The two inward peaks in Iaxial for cell 150 are numbered 1 and 2, which correspond to failed continuous excitation and successful delayed excitation, respectively. Peak 1 is provided by the suppressed upstroke of upstream cells; peak 2 by their (greater magnitude) dome. The inset is clipped above 0 pA/pF to show the inward peaks on an enlarged scale. Inactivated-closed state occupancy (IC2 + IC3) is low for cells 15 and 80 preceding the action potential upstroke, indicating minimal inactivation and high channel availability. In these cells, closed state C3 empties, indicating INa activation, which generates the upstroke. In contrast, in cell 150, peak 1 of Iaxial corresponds to a relatively large rise in IC2 + IC3 and failed INa activation (C3 occupancy remains high). When peak 2 of Iaxial is reached, C3 empties, but IC2 + IC3 occupancy increases due to slow depolarization by the small Iaxial. This suppresses INa. B: cell 150 is first depolarized by the suppressed INa, which is too small to generate a complete action potential upstroke. It depolarizes the membrane to activate L-type Ca2+ current, which then causes full depolarization. Thus the upstroke is biphasic with two different upstroke velocities (dV/dt): maximal dV/dt of the first phase is 3.66 mV/ms and of the second 4.08 mV/ms, compared with 48.00 mV/ms of the INa-supported upstroke in cell 15. C: the conduction delay causes a spatial gradient of transmembrane voltage (∇Vm) during early repolarization in F2004L (gray). This gradient generates ST-segment elevation and T-wave inversion in the computed ECG waveform Φ (top). Note that in WT (black), there is no conduction delay and a related ∇Vm. The ECG waveform returns to baseline between the QRS-complex and the upright T wave (no ST-segment elevation). au, Arbitrary unit.

Comment in

References

    1. Ackerman MJ, Splawski I, Makielski JC, Tester DJ, Will ML, Timothy KW, Keating MT, Jones G, Chadha M, Burrow CR, Stephens JC, Xu C, Judson R, Curran ME. Spectrum and prevalence of cardiac sodium channel variants among black, white, Asian, and Hispanic individuals: implications for arrhythmogenic susceptibility and Brugada/long QT syndrome genetic testing. Heart Rhythm 1: 600–607, 2004. - PubMed
    1. Albert CM, Nam EG, Rimm EB, Jin HW, Hajjar RJ, Hunter DJ, MacRae CA, Ellinor PT. Cardiac sodium channel gene variants and sudden cardiac death in women. Circulation 117: 16–23, 2008. - PubMed
    1. Antzelevitch C Late potentials and the Brugada syndrome. J Am Coll Cardiol 39: 1996–1999, 2002. - PubMed
    1. Antzelevitch C, Brugada P, Borggrefe M, Brugada J, Brugada R, Corrado D, Gussak I, LeMarec H, Nademanee K, Perez Riera AR, Shimizu W, Schulze-Bahr E, Tan H, Wilde A. Brugada syndrome: report of the second consensus conference. Endorsed by the Heart Rhythm Society and the European Heart Rhythm Association. Circulation 111: 659–670, 2005. - PubMed
    1. Antzelevitch C, Sicouri S, Litovsky SH, Lukas A, Krishnan SC, Di Diego JM, Gintant GA, Liu DW. Heterogeneity within the ventricular wall: electrophysiology and pharmacology of epicardial, endocardial, and M cells. Circ Res 69: 1427–1449, 1991. - PubMed

Publication types

MeSH terms

LinkOut - more resources