Comparative Study
. 2008 Jul;295(1):H154-62.
doi: 10.1152/ajpheart.01327.2007. Epub 2008 May 2.

Functionally distinct sodium channels in ventricular epicardial and endocardial cells contribute to a greater sensitivity of the epicardium to electrical depression

Affiliations
Comparative Study

Functionally distinct sodium channels in ventricular epicardial and endocardial cells contribute to a greater sensitivity of the epicardium to electrical depression

J M Cordeiro et al. Am J Physiol Heart Circ Physiol. 2008 Jul.

Abstract

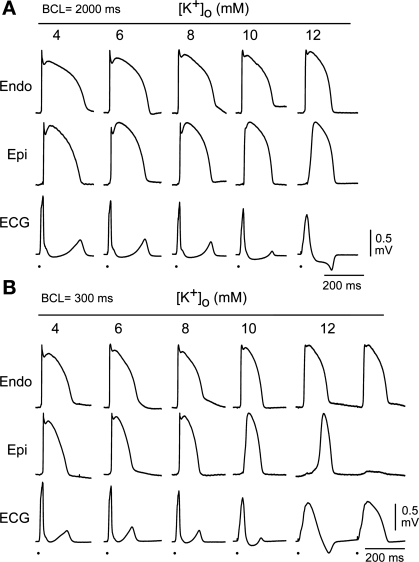
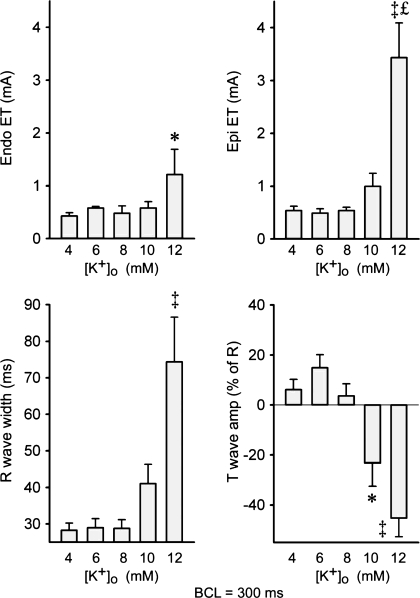
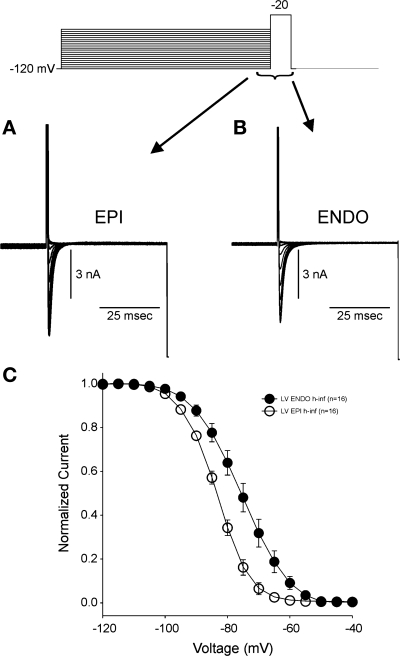
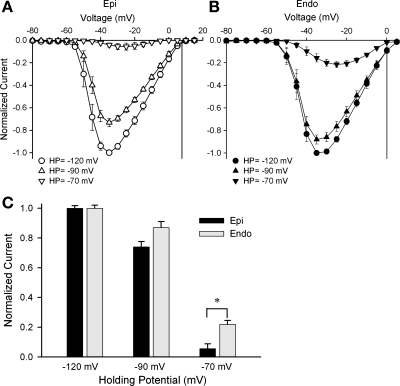
A greater depression of the action potential (AP) of the ventricular epicardium (Epi) versus endocardium (Endo) is readily observed in experimental models of acute ischemia and Brugada syndrome. Endo and Epi differences in transient outward K(+) current and/or ATP-sensitive K(+) channel current are believed to contribute to the differential response. The present study tested the hypothesis that the greater sensitivity of Epi is due in part to its functionally distinct early fast Na(+) current (I(Na)). APs were recorded from isolated Epi and Endo tissue slices and coronary-perfused wedge preparations before and after exposures to elevated extracellular K(+) concentration ([K(+)](o); 6-12 mM). I(Na) was recorded from Epi and Endo myocytes using whole cell patch-clamp techniques. In tissue slices, increasing [K(+)](o) to 12 mM reduced V(max) to 51.1 +/- 5.3% and 26.8 +/- 9.6% of control in Endo (n = 9) and Epi (n = 14), respectively (P < 0.05). In wedge preparations (n = 12), the increase in [K(+)](o) caused selective depression of Epi APs and transmural conduction slowing and block. I(Na) density was not significantly different between Epi (n = 14) and Endo (n = 15) cells, but Epi cells displayed a more negative half-inactivation voltage [-83.6 +/- 0.1 and -75.5 +/- 0.3 mV for Epi (n = 16) and Endo (n = 16), respectively, P < 0.05]. Our data suggest that reduced I(Na) availability in ventricular Epi may contribute to its greater sensitivity to electrical depression and thus may contribute to the R-ST segment changes observed under a variety of clinical conditions including acute myocardial ischemia, severe hyperkalemia, and Brugada syndrome.


Figures

Fig. 1.
Fig. 1.
Right ventricular (RV) wedge preparation exposed to increasing extracellular K+ concentrations ([K+]o). A: basic cycle length (BCL) of 2,000 ms. B: BCL of 300 ms. Endocardial (Endo; top) and epicardial (Epi; middle) action potentials (APs) and transmural ECGs are shown. Recordings were obtained under control conditions ([K+]o = 4 mM) and after perfusion of the preparations with 6, 8, 10, and 12 mM [K+]o. All AP recordings (obtained with floating microelectrodes) are scaled up to the amplitude of control recordings. Please note that the 2-to-1 Epi AP response at [K+]o = 12 mM shown in B (BCL = 300 ms) justifies the alternating T wave observed in the ECG.
Fig. 2.
Fig. 2.
Effect of 12 mM [K+]0 in the presence of 4-aminopyridine (4-AP). High [K+]o was perfused in the absence [BCLs = 2,000 (A) and 300 ms (B)] and presence of 1 mM 4-AP [BCLs = 2,000 (C) and 300 ms (D)]. The preferential rate-dependent depression of Epi AP morphology following exposure to high [K+]o persisted, indicating that the differential response between Endo and Epi is unrelated to transmural differences in transient outward K+ current. Rather, the data suggest that differences in fast Na+ current (INa) underlie the excitability disparities between the two tissues. All AP recordings (obtained with floating microelectrodes) are scaled up to the amplitude of control recordings.
Fig. 3.
Fig. 3.
Effect of increases in [K+]o on Endo excitability threshold (ET; top left) and Epi ET (top right) and on the width of the ECG R wave (bottom left) and T wave amplitude (expressed as a percentage of the R wave; bottom right). Values are means ± SE; n = 12. *P < 0.05 vs. 4 mM [K+]o; £P < 0.01 vs. Endo with 12 mM [K+]o; ‡P < 0.001 vs. 4 mM [K+]o.
Fig. 4.
Fig. 4.
Progressive electrophysiological changes following superfusion with Tyrode solution containing 12 mM [K+]o (BCL= 800 ms). A: Endo and Epi APs recorded from isolated RV tissue slices using the standard microelectrode technique. Vmax traces are shown underneath the respective APs. Consecutive sets of recordings were obtained at 5-mV depolarization intervals between the resting membrane potentials (RMPs) of −86 and −66 mV. Right traces show 5 consecutive beats of Endo and Epi APs superimposed. B: Vmax as a function of membrane depolarization in Endo and Epi. Values are means ± SE; n = 9 Endo and 14 Epi. *P < 0.05 vs. RMP of −86 mV.
Fig. 5.
Fig. 5.
Representative whole cell current recordings from an Epi (A) and Endo (B) left ventricular (LV) myocyte. Current recordings were obtained at test potentials between −80 and 10 mV in 5-mV increments from a holding potential (HP) of −120 mV. C: current-voltage (I-V) relations for Epi (n = 14) and Endo (n = 15) cells showing no differences in current density. D: steady-state activation relations for Epi and Endo. Chord conductance was determined using the ratio of current to the electromotive potential for the cells shown in C. Data were normalized and plotted against their test potential.
Fig. 6.
Fig. 6.
Representative steady-state inactivation recordings for Epi (A) and Endo (B) observed in response to the voltage-clamp protocol (top). C: steady-state inactivation relation for the two cell types. Peak currents were normalized to their respective maximum values and plotted against the conditioning potential. Epi cells showed a midinactivation potential that was significantly hyperpolarized compared with Endo cells.
Fig. 7.
Fig. 7.
I-V relations for Epi (A) and Endo (B) cells showing a reduction in current as HP is more depolarized. n = 8 cells from Epi and Endo. C: bar graph showing the maximum current available at different HPs from the two cell types. *P < 0.05.
Fig. 8.
Fig. 8.
Representative traces recorded from an Epi (A) and Endo cell (B) showing the recovery of INa. Recovery was measured using two identical voltage-clamp steps to −20 mV from a HP of −100 mV separated by selected time intervals. The recovery time course of INa, recorded from the two cell types (C), was fit by two exponentials. The slow phase of recovery was significantly slower in Epi cells (P < 0.05; C).

References

    1. Antzelevitch C The Brugada syndrome: ionic basis and arrhythmia mechanisms. J Cardiovasc Electrophysiol 12: 268–272, 2001. - PubMed
    1. Antzelevitch C, Brugada P, Borggrefe M, Brugada J, Brugada R, Corrado D, Gussak I, LeMarec H, Nademanee K, Perez Riera AR, Shimizu W, Schulze-Bahr E, Tan H, Wilde A. Brugada syndrome: report of the second consensus conference. Heart Rhythm 2: 429–440, 2005. - PubMed
    1. Ashamalla SM, Navarro D, Ward CA. Gradient of sodium current across the left ventricular wall of adult rat hearts. J Physiol 536: 439–443, 2001. - PMC - PubMed
    1. Billman GE Ro 40–5967, a novel calcium channel antagonist, protects against ventricular fibrillation. Eur J Pharmacol 229: 179–187, 1992. - PubMed
    1. Chen Q, Kirsch GE, Zhang D, Brugada R, Brugada J, Brugada P, Potenza D, Moya A, Borggrefe M, Breithardt G, Ortiz-Lopez R, Wang Z, Antzelevitch C, O'Brien RE, Schultze-Bahr E, Keating MT, Towbin JA, Wang Q. Genetic basis and molecular mechanisms for idiopathic ventricular fibrillation. Nature 392: 293–296, 1998. - PubMed

Publication types

MeSH terms

LinkOut - more resources