Diffusion of flexible random-coil dextran polymers measured in anisotropic brain extracellular space by integrative optical imaging
- PMID: 18456831
- PMCID: PMC2479597
- DOI: 10.1529/biophysj.107.124743
Diffusion of flexible random-coil dextran polymers measured in anisotropic brain extracellular space by integrative optical imaging
Abstract
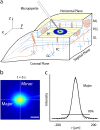
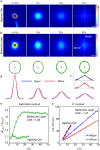
There are a limited number of methods available to quantify the extracellular diffusion of macromolecules in an anisotropic brain region, e.g., an area containing numerous aligned fibers where diffusion is faster along the fibers than across. We applied the integrative optical imaging method to measure diffusion of the fluorophore Alexa Fluor 488 (molecular weight (MW) 547) and fluorophore-labeled flexible random-coil dextran polymers (dex3, MW 3000; dex75, MW 75,000; dex282, MW 282,000; dex525, MW 525,000) in the extracellular space (ECS) of the anisotropic molecular layer of the isolated turtle cerebellum. For all molecules, two-dimensional images acquired an elliptical shape with major and minor axes oriented along and across, respectively, the unmyelinated parallel fibers. The effective diffusion coefficients, D*(major) and D*(minor), decreased with molecular size. The diffusion anisotropy ratio (DAR = D*(major)/D*(minor)) increased for Alexa Fluor 488 through dex75 but then unexpectedly reached a plateau. We argue that dex282 and dex525 approach the ECS width and deform to diffuse. In support of this concept, scaling theory shows the diffusion behavior of dex282 and dex525 to be consistent with transition to a reptation regime, and estimates the average ECS width at approximately 31 nm. These findings have implications for the interstitial transport of molecules and drugs, and for modeling neurotransmitter diffusion during ectopic release and spillover.
Figures


Similar articles
-
Enlarged extracellular space of aquaporin-4-deficient mice does not enhance diffusion of Alexa Fluor 488 or dextran polymers.Neuroscience. 2009 Jun 16;161(1):39-45. doi: 10.1016/j.neuroscience.2009.03.017. Epub 2009 Mar 19. Neuroscience. 2009. PMID: 19303428 Free PMC article.
-
Anomalous extracellular diffusion in rat cerebellum.Biophys J. 2015 May 5;108(9):2384-95. doi: 10.1016/j.bpj.2015.02.034. Biophys J. 2015. PMID: 25954895 Free PMC article.
-
Extracellular diffusion is fast and isotropic in the stratum radiatum of hippocampal CA1 region in rat brain slices.Hippocampus. 2005;15(4):441-50. doi: 10.1002/hipo.20068. Hippocampus. 2005. PMID: 15719413
-
Diffusion of molecules in brain extracellular space: theory and experiment.Prog Brain Res. 2000;125:129-54. doi: 10.1016/S0079-6123(00)25007-3. Prog Brain Res. 2000. PMID: 11098654 Review.
-
Wanted: scalable tracers for diffusion measurements.J Phys Chem B. 2014 Nov 13;118(45):12805-17. doi: 10.1021/jp5059885. Epub 2014 Nov 3. J Phys Chem B. 2014. PMID: 25319586 Free PMC article. Review.
Cited by
-
Unveiling the Extracellular Space of the Brain: From Super-resolved Microstructure to In Vivo Function.J Neurosci. 2018 Oct 31;38(44):9355-9363. doi: 10.1523/JNEUROSCI.1664-18.2018. J Neurosci. 2018. PMID: 30381427 Free PMC article. Review.
-
A Simple and Quick Method for Loading Proteins in Extracellular Vesicles.Pharmaceuticals (Basel). 2021 Apr 13;14(4):356. doi: 10.3390/ph14040356. Pharmaceuticals (Basel). 2021. PMID: 33924377 Free PMC article.
-
Distribution and Diffusion of Macromolecule Delivery to the Brain via Focused Ultrasound using Magnetic Resonance and Multispectral Fluorescence Imaging.Ultrasound Med Biol. 2020 Jan;46(1):122-136. doi: 10.1016/j.ultrasmedbio.2019.08.024. Epub 2019 Oct 2. Ultrasound Med Biol. 2020. PMID: 31585767 Free PMC article.
-
Probing the extracellular diffusion of antibodies in brain using in vivo integrative optical imaging and ex vivo fluorescence imaging.J Control Release. 2015 Jan 10;197:78-86. doi: 10.1016/j.jconrel.2014.10.034. Epub 2014 Nov 7. J Control Release. 2015. PMID: 25449807 Free PMC article.
-
Current Techniques for Investigating the Brain Extracellular Space.Front Neurosci. 2020 Oct 14;14:570750. doi: 10.3389/fnins.2020.570750. eCollection 2020. Front Neurosci. 2020. PMID: 33177979 Free PMC article. Review.
References
-
- Rice, M. E., Y. C. Okada, and C. Nicholson. 1993. Anisotropic and heterogeneous diffusion in the turtle cerebellum: implications for volume transmission. J. Neurophysiol. 70:2035–2044. - PubMed
-
- Prokopová, Š., L. Vargová, and E. Syková. 1997. Heterogeneous and anisotropic diffusion in the developing rat spinal cord. Neuroreport. 8:3527–3532. - PubMed
-
- Voříšek, I., and E. Syková. 1997. Evolution of anisotropic diffusion in the developing rat corpus callosum. J. Neurophysiol. 78:912–919. - PubMed
-
- Bjelke, B., R. England, C. Nicholson, M. E. Rice, J. Lindberg, M. Zoli, L. F. Agnati, and K. Fuxe. 1995. Long distance pathways of diffusion for dextran along fiber bundles in brain. Relevance for volume transmission. Neuroreport. 6:1005–1009. - PubMed
Publication types
MeSH terms
Substances
Grants and funding
LinkOut - more resources
Full Text Sources
Other Literature Sources
Medical

