. 2008 Aug;95(3):1118-25.
doi: 10.1529/biophysj.107.122564. Epub 2008 May 2.

Monte Carlo study of single molecule diffusion can elucidate the mechanism of B cell synapse formation

Affiliations

Monte Carlo study of single molecule diffusion can elucidate the mechanism of B cell synapse formation

Philippos K Tsourkas et al. Biophys J. 2008 Aug.

Abstract

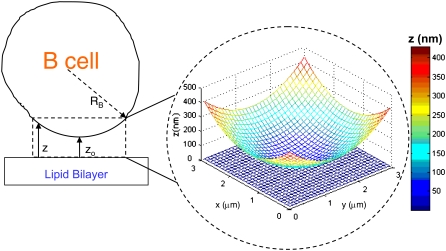
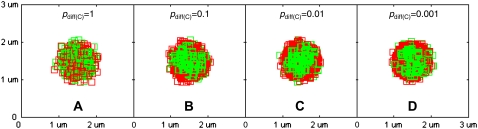
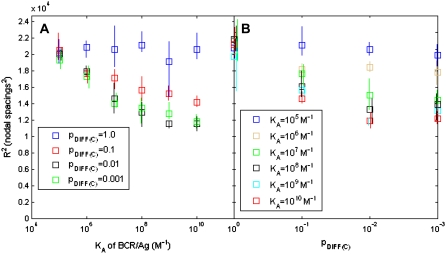
B cell receptors have been shown to cluster at the intercellular junction between a B cell and an antigen-presenting cell in the form of a segregated pattern of B cell receptor/antigen complexes known as an immunological synapse. We use random walk-based theoretical arguments and Monte Carlo simulations to study the effect of diffusion of surface-bound molecules on B cell synapse formation. Our results show that B cell synapse formation is optimal for a limited range of receptor-ligand complex diffusion coefficient values, typically one-to-two orders of magnitude lower than the diffusion coefficient of free receptors. Such lower mobility of receptor-ligand complexes can significantly affect the diffusion of a tagged receptor or ligand in an affinity dependent manner, as the binding/unbinding of such receptor or ligand molecules crucially depends on affinity. Our work shows how single molecule tracking experiments can be used to estimate the order of magnitude of the diffusion coefficient of receptor-ligand complexes, which is difficult to measure directly in experiments due to the finite lifetime of receptor-ligand bonds. We also show how such antigen movement data at the single molecule level can provide insight into the B cell synapse formation mechanism. Thus, our results can guide further single molecule tracking experiments to elucidate the synapse formation mechanism in B cells, and potentially in other immune cells.


Figures

FIGURE 1
FIGURE 1
Schematic of the cell-bilayer system simulated in our model. The bilayer and cell surfaces are modeled as N*N Cartesian lattices. We use a lattice spacing of 10 nm and simulate a 3 μm × 3 μm area on the bilayer and its projection on the cell surface. The initial vertical separation distance z(x,y) is given by Eq. 1. The 3 μm × 3 μm simulated area is chosen to include the entire area where z is small enough for receptor-ligand binding to be physically possible.
FIGURE 2
FIGURE 2
Flow chart of the Monte Carlo model.
FIGURE 3
FIGURE 3
Effect of receptor-ligand complex mobility on immune synapse formation. BCR/Antigen complexes are shown in green and LFA-1/ICAM-1 complexes in red. In this set of images, the diffusion probability of receptor ligand complexes, pdiff(C), directly analogous to the diffusion coefficient, D, is varied across orders of magnitude from pdiff(C) = 1 to pdiff(C) = 10−4, whereas the diffusion probability of receptor ligand complexes is fixed at pdiff(F) = 1. High complex mobility is detrimental to synapse formation (A). These patterns were obtained after 105 time steps (t = 100 s) with the parameter values given in Table 1.
FIGURE 4
FIGURE 4
Plots of the trajectories of four individual antigen molecules (A and D), the resulting segregation patterns formed by the receptor-ligand complexes (B and E) and the square of the distance each antigen molecule has covered (C and F). A–C represent high BCR affinity (KA = 1011 M−1) whereas D–F represent low BCR affinity (KA = 106 M−1). In (A and D), black stars represent the start of the trajectory and red stars represent the end of the trajectory. Each antigen molecule trajectory in (A and D) corresponds to an R2(t) plot in (C and F). The inversion in the canonical synapse pattern in (B) is due to differences in koff between BCR/Ag and LFA-1/ICAM-1 (21). The plots were obtained after 105 time steps (t = 100 s), with pdiff(C) = 0.1, pdiff(F) = 1, and the remaining parameters as given in Table 1.
FIGURE 5
FIGURE 5
Plots of R2(t) obtained from averaging 1000 individual trials (such as those in Fig. 4, C and F). BCR affinity was varied from KA = 106 to KA = 1010 M−1. When pdiff(C) = 1, there is little separation among the curves, but when pdiff(C) = 0.1, we clearly see that the final value of R2(t) decreases as affinity increases.
FIGURE 6
FIGURE 6
Plots of the final value of 〈R2(t)〉 as a function of BCR/Ag affinity (A) and pdiff(C) (B). In (A), each series represents a constant value of pdiff(C). We see that the final value of R2(t) decreases as BCR/Ag affinity increases for pdiff(C) = 10−1–10−3 but remains the same for pdiff(C) = 1. If it were possible to measure the final value of R2 for a large number of antigen molecules as BCR/Ag affinity is varied from KA = 106 to KA = 1010 M−1, it would be possible to determine the order of magnitude of pdiff(C) (and hence the diffusion coefficient of receptor-ligand complexes) by noting whether the final value of R2(t) decreases or remains constant as BCR/Ag affinity increases. In (B), each series represents a constant BCR/Ag affinity value. For low BCR/Ag affinity (105–106 M−1) there is little decrease in the final value of R2(t) as pdiff(C) decreases.

References

    1. Lauffenburger, D. A., and J. J. Linderman. 1993. Models for binding, trafficking and signaling. Oxford University Press, Oxford.
    1. Wülfing, C., M. D. Sjaastad, and M. M. Davis. 1998. Visualizing the dynamics of T cell activation: Intracellular adhesion molecule 1 migrates rapidly to the T cell/B cell interface and acts to sustain calcium levels. Proc. Natl. Acad. Sci. USA. 95:6302–6307. - PMC - PubMed
    1. Monks, C. R., B. A. Freiberg, H. Kupfer, N. Sciaky, and A. Kupfer. 1998. Three-dimensional segregation of supramolecular activation clusters in T cells. Nature. 395:82–86. - PubMed
    1. Grakoui, A., S. K. Bromley, C. Sumen, M. M. Davis, A. S. Shaw, P. M. Allen, and M. L. Dustin. 1999. The immunological synapse: a molecular machine controlling T cell activation. Science. 285:221–227. - PubMed
    1. Krummel, M. F., M. D. Sjaastad, C. Wulfing, and M. M. Davis. 2000. Differential clustering of CD4 and CD3ζ during T cell recognition. Science. 289:1349–1352. - PubMed

Substances

LinkOut - more resources