. 2008 Aug;18(8):1259-69.
doi: 10.1101/gr.075713.107. Epub 2008 May 2.

DXZ4 chromatin adopts an opposing conformation to that of the surrounding chromosome and acquires a novel inactive X-specific role involving CTCF and antisense transcripts

Affiliations

DXZ4 chromatin adopts an opposing conformation to that of the surrounding chromosome and acquires a novel inactive X-specific role involving CTCF and antisense transcripts

Brian P Chadwick. Genome Res. 2008 Aug.

Abstract

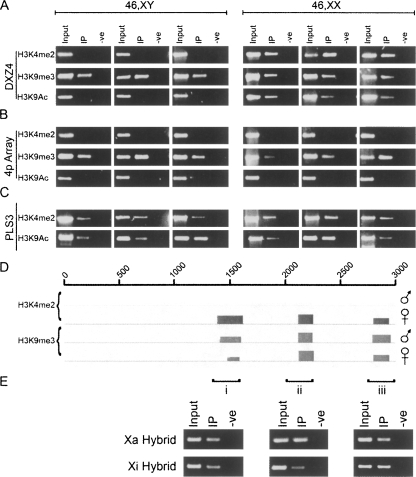
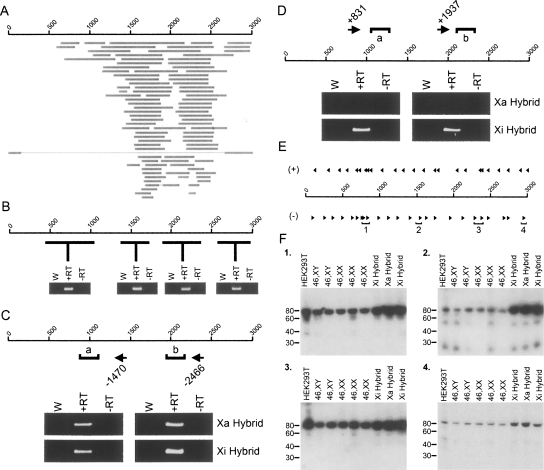
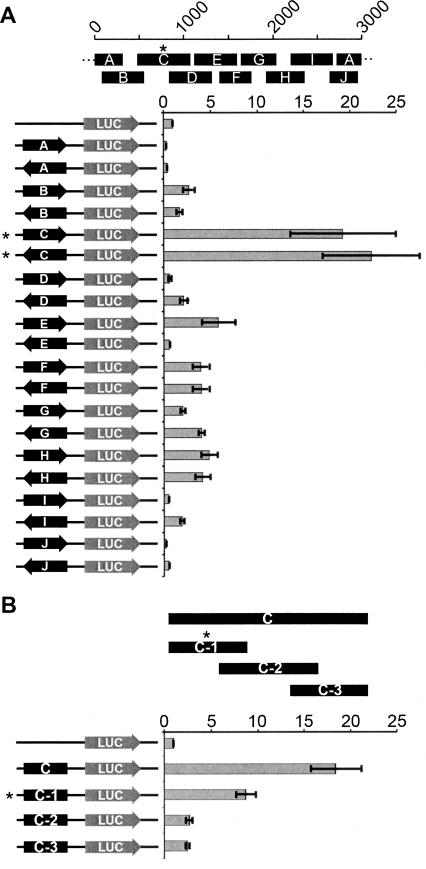
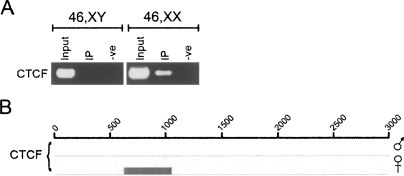
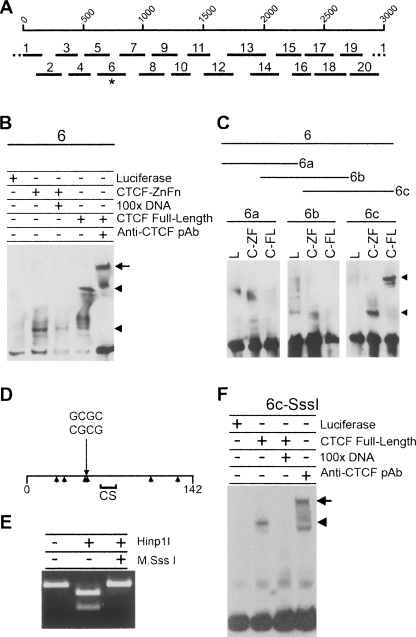
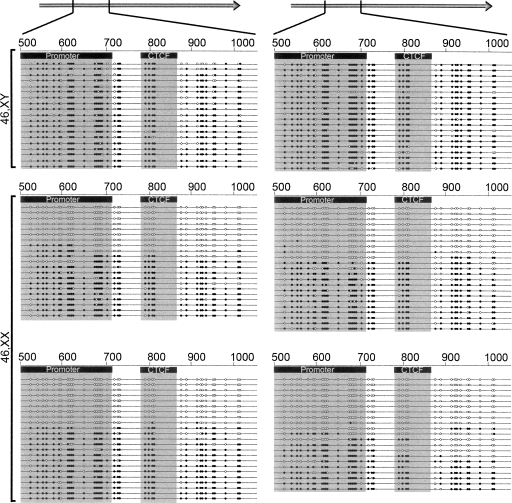
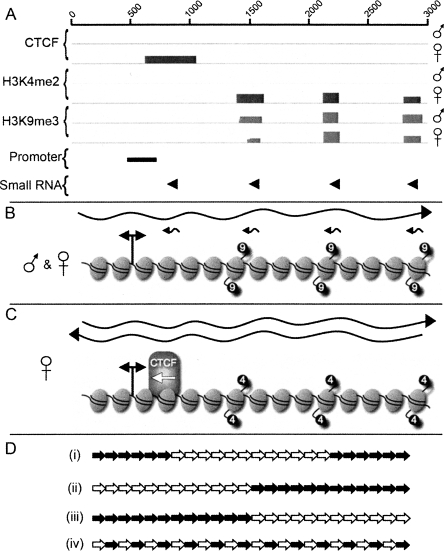
Macrosatellite DNA is composed of large repeat units, arranged in tandem over hundreds of kilobases. The macrosatellite repeat DXZ4, localized at Xq23-24, consists of 50-100 copies of a CpG-rich 3-kb monomer. Here I report that on the active X chromosome (Xa), DXZ4 is organized into constitutive heterochromatin characterized by a highly organized pattern of H3K9me3. DXZ4 is expressed from both strands and generates an antisense transcript that is processed into small RNAs that directly correlate with H3K9me3 nucleosomes. In contrast, on the inactive X chromosome (Xi) a proportion of DXZ4 is packaged into euchromatin characterized by H3K4me2 and H3K9Ac. The Xi copy of DXZ4 is bound by the chromatin insulator, CTCF, within a sequence that unidirectionally blocks enhancer-promoter communication. Immediately adjacent to the CTCF-binding site is a bidirectional promoter that, like the sequence flanking the CTCF-binding region, is completely devoid of CpG methylation on the Xi. As on the Xa, both strands are expressed, but longer antisense transcripts can be detected in addition to the processed small RNAs. The euchromatic organization of DXZ4 on the otherwise heterochromatic Xi, its binding of CTCF, and its function as a unidirectional insulator suggest that this macrosatellite has acquired a novel function unique to the process of X chromosome inactivation.


Figures

Figure 1.
Figure 1.
DXZ4 on the inactive X chromosome adopts a Xi-specific euchromatin-like conformation. (A) Ethidium bromide (EtBr) agarose gels of H3K4me2, H3K9me3, and H3K9Ac ChIP assessed by PCR for co-immunoprecipitation of DNA from the Xq23 macrosatellite DXZ4, and (B) an unrelated macrosatellite on chromosome 4p (4p array). Results are shown for three independent primary male and female cell lines. (C) PCR analysis of the plastin 3 promoter (PLS3). Samples include the input, experimental (IP), and control (-ve). (D) Close-up of ChIP-chip data for a single 3-kb DXZ4 monomer (0–3000 bp) with H3K4me2 and H3K9me3 in a male and female sample. The coordinates at the top of the image represent nucleotides 114,785,064–114,788,023 of Human Genome Build HG17. Immediately below the line is the NimbleGen Signal Map 1.8 output for the H3K4me2 and H3K9me3 ChIP-chip. The width of the signal indicates the extent of the hybridization. (E) H3K9me3 ChIP from the Xa and Xi hybrid assessed by PCR. The three regions analyzed by PCR are indicated by i–iii and correspond to the sites of the H3K9me3 peaks defined by ChIP-chip.
Figure 2.
Figure 2.
A long DXZ4 sense transcript and antisense small RNAs are common to the Xa and Xi arrays, whereas an antisense transcript is specific to the Xi. (A) Location of human ESTs with >94% sequence match to DXZ4. The scale of 1–3000 represents the 3-kb coordinates of a single DXZ4 monomer in bp. Horizontal gray bars represent individual EST matches. (B) A single 3-kb DXZ4 monomer is represented by a 1–3000 bp scale. Below the scale are the results of a selection of RT-PCR analyses on random-hexamer primed cDNA (i.e. strand-independent). The approximate region of DXZ4 PCR amplified is represented by the horizontal black lines. Each RT-PCR shows water control (W), with reverse transcriptase (+RT) and a no reverse transcriptase control (−RT). (C) Strand-specific RT-PCR analysis of DXZ4 RNA in Xa and Xi hybrids for the sense transcript. The 1–3000 bp scale represents a single 3-kb DXZ4 monomer. The location and starting coordinate of antisense or sense priming oligonucleotides are indicated by the left- and right-pointing arrows, respectively. PCR for each strand-specific RT reaction “a” (980–1221) and “b” (2106–2358) are indicated. Ethidium bromide gel images of water control (W), with reverse transcriptase (+RT) or without (−RT) are shown. (D) Strand-specific RT-PCR analysis of DXZ4 RNA in Xa and Xi hybrids for the antisense transcript. (E) The approximate location of 19–21 bp oligonucleotides hybridized to Northern blots are shown above and below DXZ4 for sense (+) and antisense (−) transcript detection, respectively. Small RNA hybridizing oligonucleotides are highlighted by regions 1–4. (F) Northern blots for oligonucleotides from regions 1–4. The size in bp is shown to the left. An example of an ethidium bromide stained polyacrylamide gel showing the small RNAs can be seen in Supplemental Figure 5A.
Figure 3.
Figure 3.
Identification of a bidirectional promoter in DXZ4. (A) A single 3-kb DXZ4 monomer is represented by 0–3000 bp scale. The approximate location of subfragments A–J are shown below the monomer. DXZ4 subfragments cloned upstream of the Luciferase reporter gene in pGL3-Basic are shown to the left. The orientation of the fragment is represented by the arrow. The level of luciferase activity detected relative to that of the empty vector (assigned a value of 1) is indicated (0–25×). (B) DXZ4 subfragment C is represented by the black solid bar, below which are shown the relative locations of the three subregions. Below are shown the five different pGL3-Basic constructs tested for luciferase activity. All data (A,B) represent the mean and standard error for four independent experiments. The asterisk highlights the subregion fragment that retained the most promoter activity.
Figure 4.
Figure 4.
CTCF binds to a single region of DXZ4 on the Xi only. (A) ChIP with CTCF co-immunoprecipitates DXZ4 DNA in females only. The samples shown are one example of four independent male and female cell line ChIP experiments that showed the same result. (B) Close-up of ChIP-chip data for a single 3-kb DXZ4 monomer (0–3000 bp) with CTCF in a male and female sample. The coordinates at the top of the image represent nucleotides 114,785,064–114,788,023 of Human Genome Build HG17. Immediately below the line is the NimbleGen Signal Map 1.8 output for the CTCF ChIP-chip. The width of the signal indicates the extent of the hybridization.
Figure 5.
Figure 5.
CTCF binds to DXZ4 DNA in vitro independent of flanking CpG methylation. (A) A single 3-kb DXZ4 monomer is represented by 1–3000 bp scale, under which are shown the 20 different fragments used in the original EMSA analysis (see Supplemental Fig. 2). The asterisk indicates fragment-6, the mobility of which is retarded in the presence of CTCF protein. (B) Confirmation of CTCF specificity by 100× excess competition with unlabeled 6-DNA and supershift (upper arrowhead and arrow, respectively). (C) Refining CTCF to 6c only in the presence of the CTCF zinc fingers region (C-ZF) and full-length CTCF (C-FL) as indicated by the arrowheads, but not by luciferase (L). (D) Map of fragment 6c. The 142-bp fragment 6c is represented by the horizontal line, with the location of the Hinp1I site (GCGC) indicated. Arrowheads below the line indicate location of CpG sequences. The region denoted CS indicates a region with a good match to the CTCF genome-wide consensus sequence (Kim et al. 2007). (E) In vitro methylation of fragment 6c by M.SssI CpG methyltransferase blocks digestion by the methyl-sensitive Hinp1I restriction endonuclease. (F) CTCF binding to CpG methylated fragment 6c (Me-6c).
Figure 6.
Figure 6.
CpG sequences at the promoter and CTCF-binding regions of DXZ4 are methylated on the active X but unmethylated on the inactive X chromosome. Gray arrows at the top of the image represent a single DXZ4 monomer, with the region under analysis highlighted (498–1033 bp). Below shows the CpG methylation status of the region for two independent male and four independent female cell lines. The location of the minimal promoter region and the smallest CTCF EMSA fragment are indicated by the black boxes and the gray shadow. Each line represents the sequence of an individual clone. The location of CpG sequences is indicated by the circles on the lines, with open circles indicating unmethylated and black filled circles as methylated CpGs.
Figure 7.
Figure 7.
DXZ4 unidirectionally interferes with promoter–enhancer communication in vitro, an attribute confined to DNA encompassing the CTCF binding site. (A) Schematic representation of the different constructs are labeled and shown on the left. The location of the diphtheria toxin-A gene (TOX), hygromycin-B resistance gene (HygR), insert (Insert), and SV40 enhancer (En) are indicated for the rectangles and circles. Insert identity is indicated to the left of each construct. The orientation of DXZ4 inserts are represented by the black arrows. The graph to the right indicates the number of colonies obtained for each construct after 2–3 wk of selection for hygromycin-B. Data represents the mean and standard error for four independent experiments. (B) A single 3-kb DXZ4 monomer is represented by the 1–3000 bp scale. The approximate location of subfragments A–J are shown below the monomer. Data obtained as for A. The asterisk highlights the subfragment that retained most of the insulator activity. (C) Representation of the subfragments of C (C1–C3) that were cloned in either orientation into pREP-ToxA. The P indicates the fragment containing the highest promoter activity, whereas the EB indicates the fragment containing enhancer-blocking activity determined below. (D) Data obtained for the C subfragments determined as for A.
Figure 8.
Figure 8.
Summary of the chromatin organization and transcription of DXZ4 on the active and inactive X chromosomes and a schematic model of how this organization might be arranged at Xq23. (A) Combined summary of ChIP-chip, luciferase, and small RNA Northern data for a single 3-kb monomer. (B) Summary illustration of DXZ4 chromatin and transcripts in males and at the Xa. The wavy right-pointing black arrow represents the >3-kb sense strand transcript. Small left-pointing arrows represent small antisense RNAs. The elliptical shapes represent nucleosomes. A total of 15 nucleosomes are arbitrarily assigned to a single DXZ4 monomer based on ∼200-bp per nucleosome. The nucleosomes corresponding to the peaks of H3K9me3 signal are indicated by the “9”-labeled black circles. The bidirectional promoter is indicated by the double-headed arrow. (C) Summary illustration of DXZ4 chromatin and transcripts as determined for the Xi. The left- and right-facing wavy arrows represent the sense and antisense DXZ4 transcripts. The nucleosomes corresponding to the peaks of H3K4me2 signal are indicated by the “4”-labeled black circles. The position of CTCF binding is indicated by the CTCF labeled shape, and the left-pointing white arrow represents the direction of promoter–enhancer interference activity. (D) Schematic representation of possible Xi arrangement of H3K4me2 defined monomers (white arrows) and H3K9me3 monomers (black arrows). Each arrow represents a full 3-kb monomer. Only 24 of a potential 50–100 monomers were used for illustrative purposes.

Similar articles

Cited by

References

    1. Bell A.C., Felsenfeld G., Felsenfeld G. Methylation of a CTCF-dependent boundary controls imprinted expression of the Igf2 gene. Nature. 2000;405:482–485. - PubMed
    1. Bell A.C., West A.G., Felsenfeld G., West A.G., Felsenfeld G., Felsenfeld G. The protein CTCF is required for the enhancer blocking activity of vertebrate insulators. Cell. 1999;98:387–396. - PubMed
    1. Boggs B.A., Cheung P., Heard E., Spector D.L., Chinault A.C., Allis C.D., Cheung P., Heard E., Spector D.L., Chinault A.C., Allis C.D., Heard E., Spector D.L., Chinault A.C., Allis C.D., Spector D.L., Chinault A.C., Allis C.D., Chinault A.C., Allis C.D., Allis C.D. Differentially methylated forms of histone H3 show unique association patterns with inactive human X chromosomes. Nat. Genet. 2002;30:73–76. - PubMed
    1. Boumil R.M., Ogawa Y., Sun B.K., Huynh K.D., Lee J.T., Ogawa Y., Sun B.K., Huynh K.D., Lee J.T., Sun B.K., Huynh K.D., Lee J.T., Huynh K.D., Lee J.T., Lee J.T. Differential methylation of Xite and CTCF sites in Tsix mirrors the pattern of X-inactivation choice in mice. Mol. Cell. Biol. 2006;26:2109–2117. - PMC - PubMed
    1. Brown C.J., Willard H.F., Willard H.F. Noninactivation of a selectable human X-linked gene that complements a murine temperature-sensitive cell cycle defect. Am. J. Hum. Genet. 1989;45:592–598. - PMC - PubMed

Publication types

MeSH terms