

Pontine reticular formation (PnO) administration of hypocretin-1 increases PnO GABA levels and wakefulness
- PMID: 18457232
- PMCID: PMC2279760
- DOI: 10.1093/sleep/31.4.453
Pontine reticular formation (PnO) administration of hypocretin-1 increases PnO GABA levels and wakefulness
Abstract
Study objectives: GABAergic transmission in the oral part of the pontine reticular formation (PnO) increases wakefulness. The hypothalamic peptide hypocretin-1 (orexin A) promotes wakefulness, and the PnO receives hypocretinergic input. The present study tested the hypothesis that PnO administration of hypocretin-1 increases PnO GABA levels and increases wakefulness. This study also tested the hypothesis that wakefulness is either increased or decreased, respectively, by PnO administration of drugs known to selectively increase or decrease GABA levels.
Design: Awithin-subjects design was used for microdialysis and microinjection experiments.
Setting: University of Michigan.
Patients or participants: Experiments were performed using adult male Crl:CD (SD)IGS BR (Sprague-Dawley) rats (n=46).
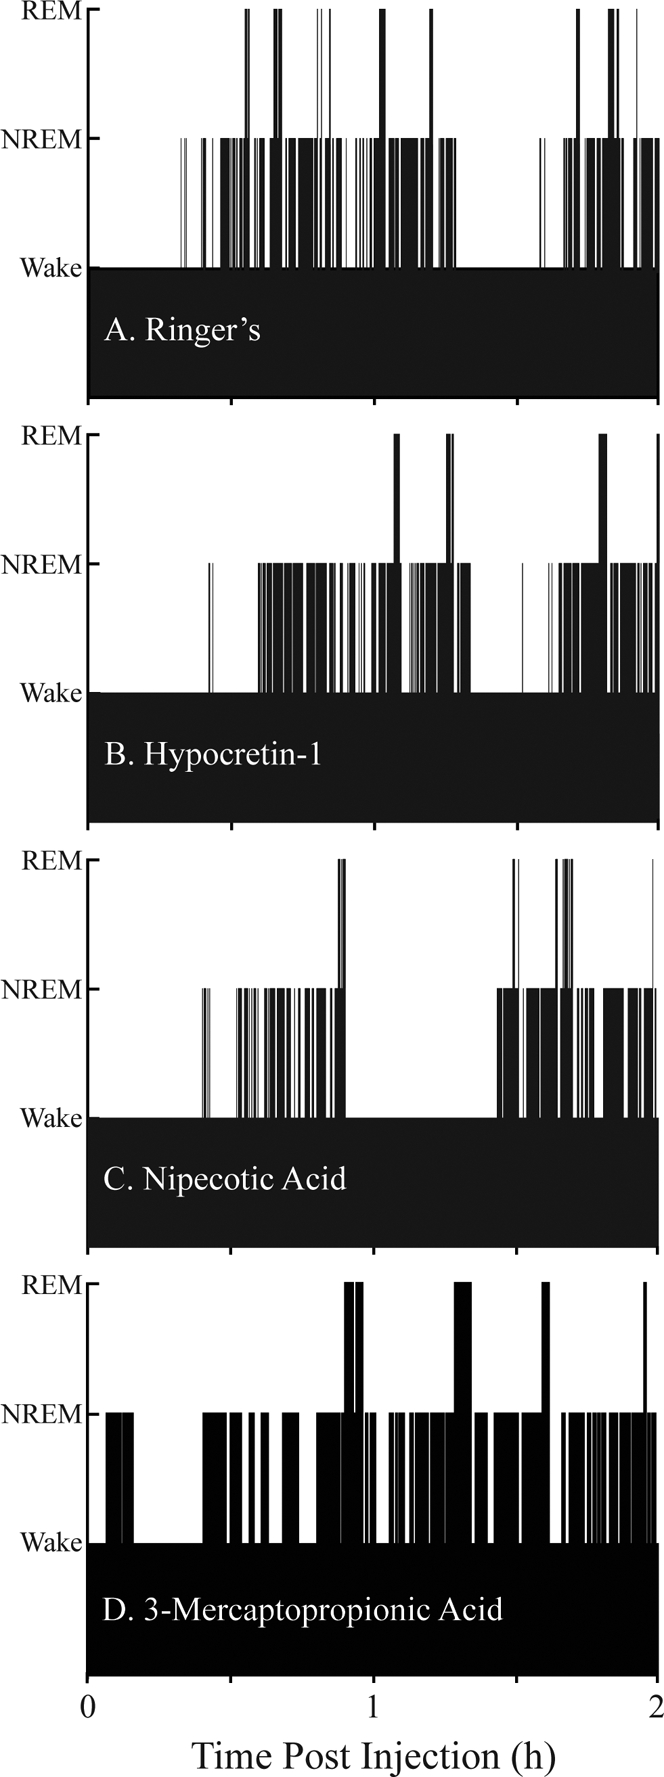
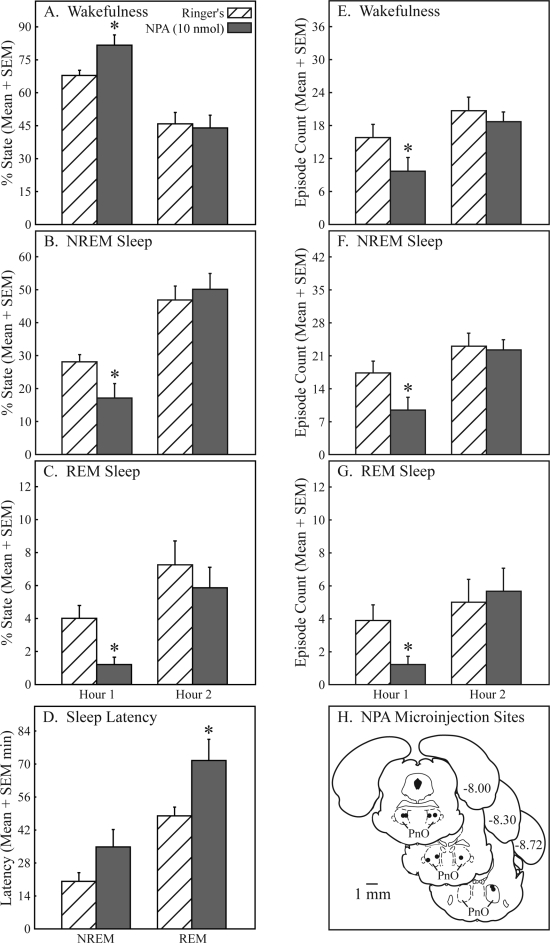
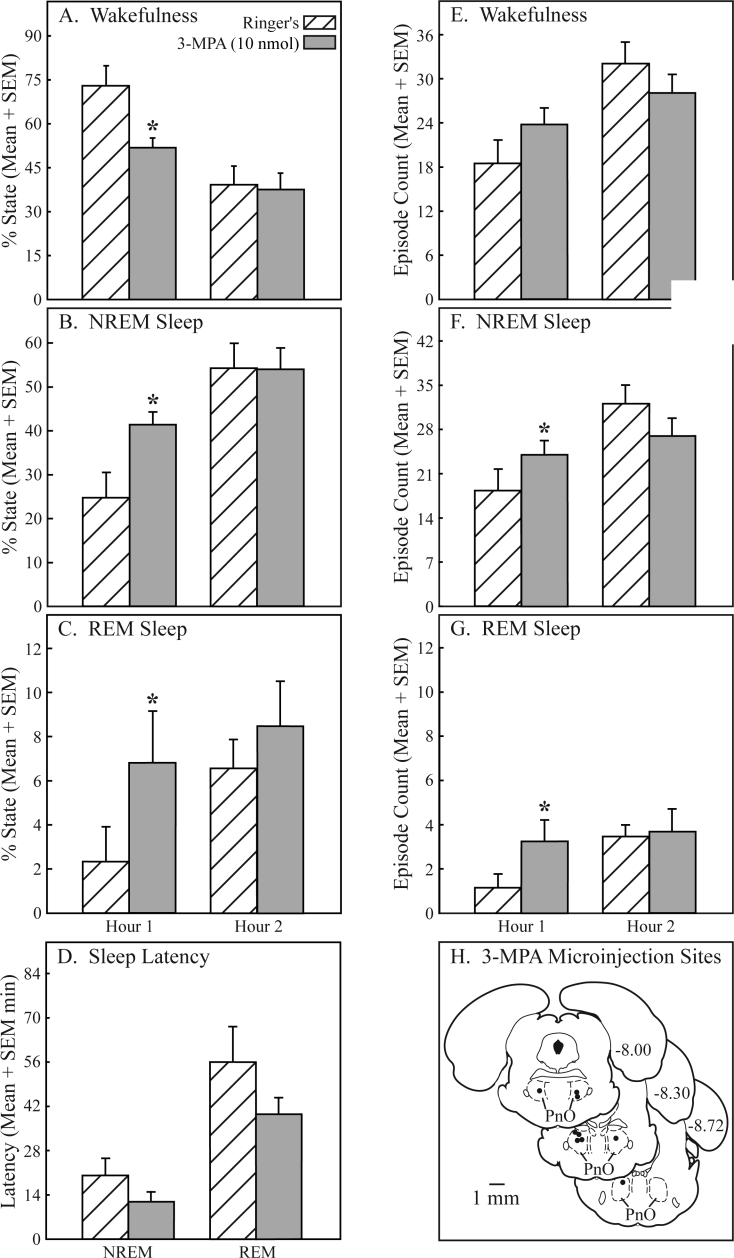
Interventions: PnO administration of hypocretin-1, nipecotic acid (a GABA uptake inhibitor that increases extracellular GABA levels), 3-mercaptopropionic acid (a GABA synthesis inhibitor that decreases extracellular GABA levels; 3-MPA), and Ringer solution (vehicle control).
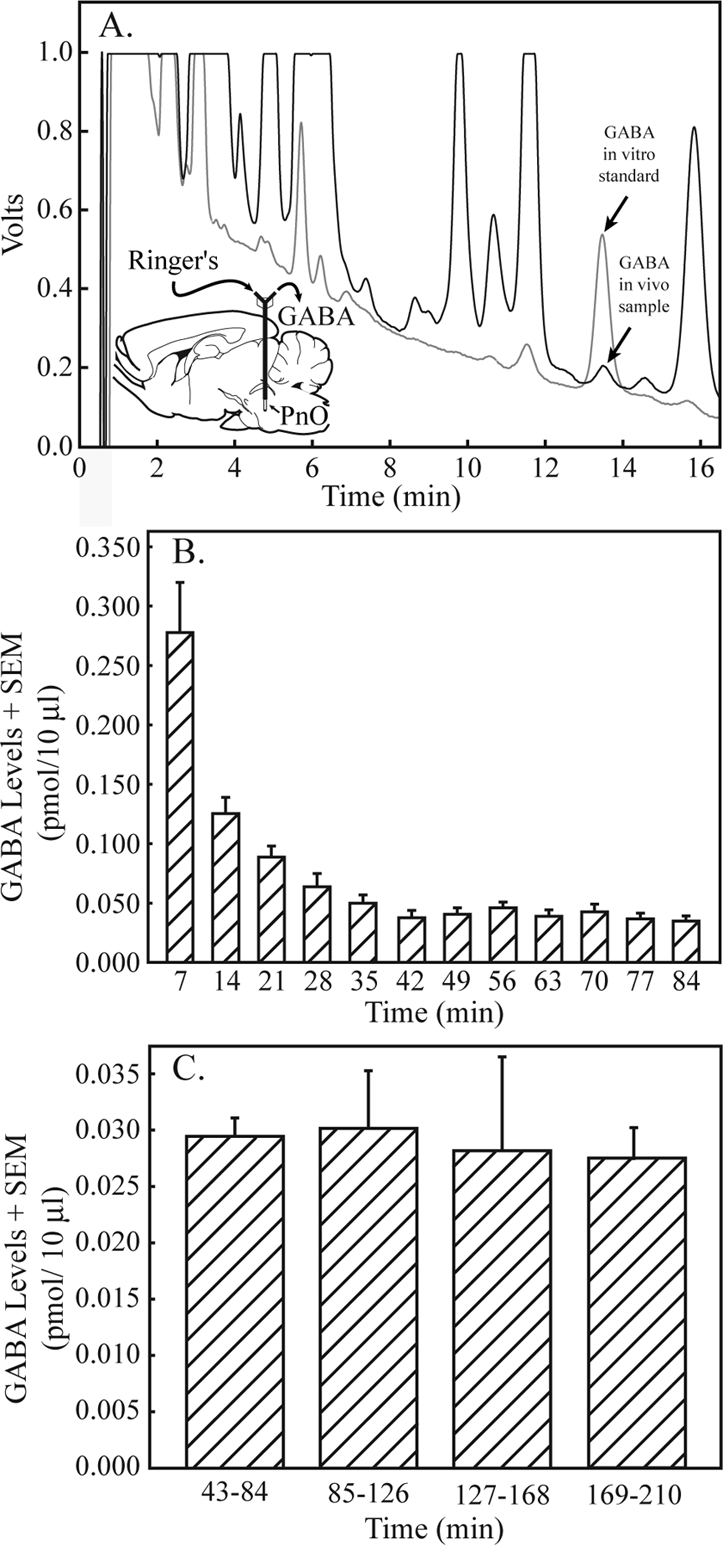
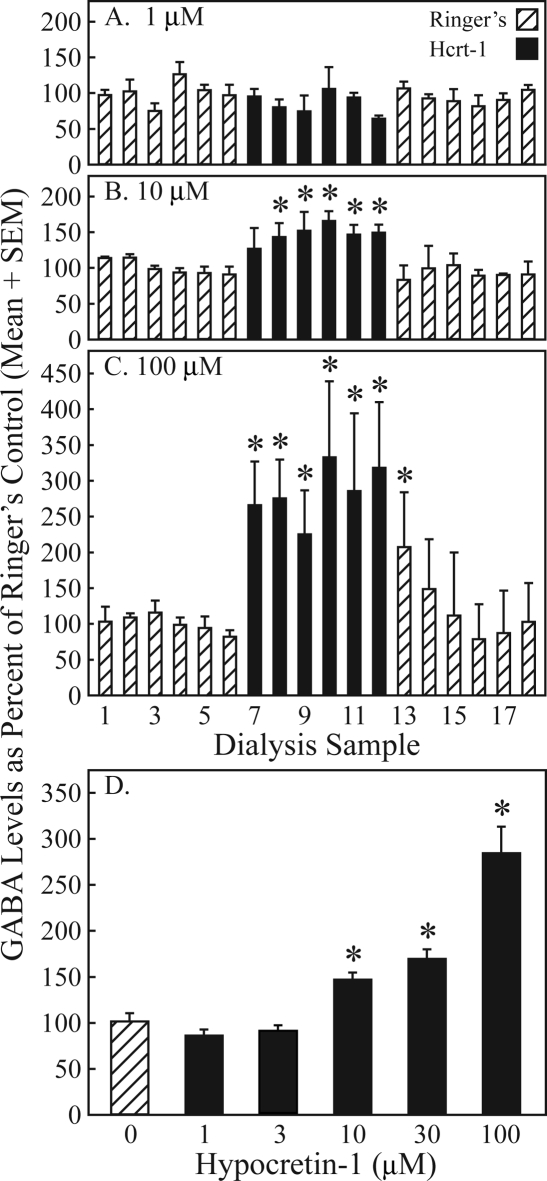
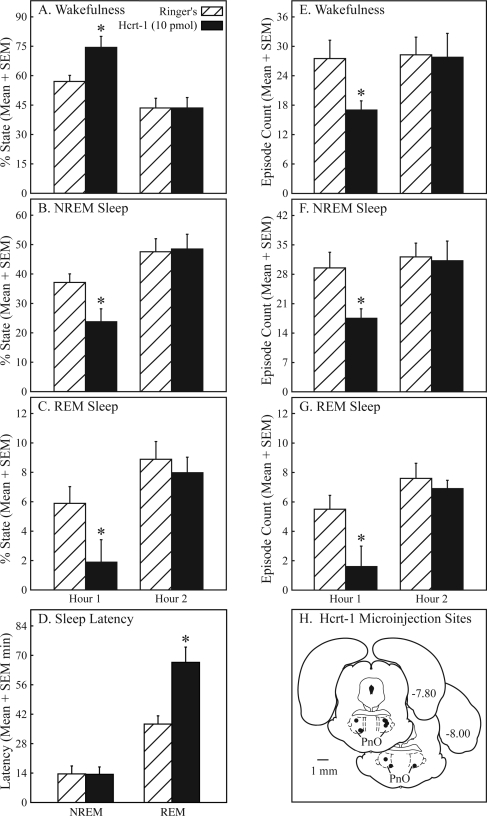
Measurements and results: Dialysis administration of hypocretin-1 to the PnO caused a statistically significant, concentration-dependent increase in PnO GABA levels. PnO microinjection of hypocretin-1 or nipecotic acid caused a significant increase in wakefulness and a significant decrease in non-rapid eye movement (NREM) sleep and REM sleep. Microinjecting 3-MPA into the PnO caused a significant increase in NREM sleep and REM sleep and a significant decrease in wakefulness.
Conclusions: An increase or a decrease in PnO GABA levels causes an increase or decrease, respectively, in wakefulness. Hypocretin-1 may promote wakefulness, at least in part, by increasing GABAergic transmission in the PnO.
Figures
Similar articles
-
Hypocretin and GABA interact in the pontine reticular formation to increase wakefulness.Sleep. 2010 Oct;33(10):1285-93. doi: 10.1093/sleep/33.10.1285. Sleep. 2010. PMID: 21061850 Free PMC article.
-
Sleep and GABA levels in the oral part of rat pontine reticular formation are decreased by local and systemic administration of morphine.Neuroscience. 2007 Jan 5;144(1):375-86. doi: 10.1016/j.neuroscience.2006.09.007. Epub 2006 Oct 19. Neuroscience. 2007. PMID: 17055662 Free PMC article.
-
GABA(A) receptors in the pontine reticular formation of C57BL/6J mouse modulate neurochemical, electrographic, and behavioral phenotypes of wakefulness.J Neurosci. 2010 Sep 15;30(37):12301-9. doi: 10.1523/JNEUROSCI.1119-10.2010. J Neurosci. 2010. PMID: 20844126 Free PMC article.
-
[Modulation by the GABA of the ventro-oral-pontine reticular REM sleep-inducing neurons].An R Acad Nac Med (Madr). 2007;124(2):397-411; discussion 411-3. An R Acad Nac Med (Madr). 2007. PMID: 18069603 Review. Spanish.
-
Carbachol models of REM sleep: recent developments and new directions.Arch Ital Biol. 2001 Feb;139(1-2):147-68. Arch Ital Biol. 2001. PMID: 11256182 Review.
Cited by
-
Gamma-aminobutyric acid-mediated neurotransmission in the pontine reticular formation modulates hypnosis, immobility, and breathing during isoflurane anesthesia.Anesthesiology. 2008 Dec;109(6):978-88. doi: 10.1097/ALN.0b013e31818e3b1b. Anesthesiology. 2008. PMID: 19034094 Free PMC article.
-
Hypocretinergic and non-hypocretinergic projections from the hypothalamus to the REM sleep executive area of the pons.Brain Res. 2013 Jan 23;1491:68-77. doi: 10.1016/j.brainres.2012.10.050. Epub 2012 Oct 30. Brain Res. 2013. PMID: 23122879 Free PMC article.
-
Hypocretin/Orexin neuropeptides: participation in the control of sleep-wakefulness cycle and energy homeostasis.Curr Neuropharmacol. 2009 Mar;7(1):50-9. doi: 10.2174/157015909787602797. Curr Neuropharmacol. 2009. PMID: 19721817 Free PMC article.
-
Benzodiazepine receptor agonists cause drug-specific and state-specific alterations in EEG power and acetylcholine release in rat pontine reticular formation.Sleep. 2010 Jul;33(7):909-18. doi: 10.1093/sleep/33.7.909. Sleep. 2010. PMID: 20614851 Free PMC article.
-
Dorsomedial pontine neurons with descending projections to the medullary reticular formation express orexin-1 and adrenergic alpha2A receptor mRNA.Neurosci Lett. 2009 Aug 14;459(3):115-8. doi: 10.1016/j.neulet.2009.05.011. Epub 2009 May 7. Neurosci Lett. 2009. PMID: 19427365 Free PMC article.
References
-
- Bateson AN. Further potential of the GABA receptor in the treatment of insomnia. Sleep Med. 2006;7S1:S3–9.
-
- Lydic R, Baghdoyan HA. Sleep, anesthesiology, and the neurobiology of arousal state control. Anesthesiology. 2005;103:1268–95. - PubMed
-
- Mashour GA, Forman SA. Mechanisms of general anesthesia: from molecules to mind. Best Prac Res Clin Anaesthesiol. 2005;19:349–64. - PubMed
-
- Rudolph U, Antkowiak B. Molecular and neuronal substrates for general anaesthetics. Nat Rev Neurosci. 2004;7:709–20. - PubMed
-
- Drake CL, Roehrs T, Roth T. Insomnia causes, consequences, and therapeutics: an overview. Depress Anxiety. 2003;18:163–76. - PubMed
