. 2008 May 6:1:14.
doi: 10.1186/1755-8794-1-14.

The role of the small intestine in the development of dietary fat-induced obesity and insulin resistance in C57BL/6J mice

Affiliations

The role of the small intestine in the development of dietary fat-induced obesity and insulin resistance in C57BL/6J mice

Nicole Jw de Wit et al. BMC Med Genomics. .

Abstract

Background: Obesity and insulin resistance are two major risk factors underlying the metabolic syndrome. The development of these metabolic disorders is frequently studied, but mainly in liver, skeletal muscle, and adipose tissue. To gain more insight in the role of the small intestine in development of obesity and insulin resistance, dietary fat-induced differential gene expression was determined along the longitudinal axis of small intestines of C57BL/6J mice.

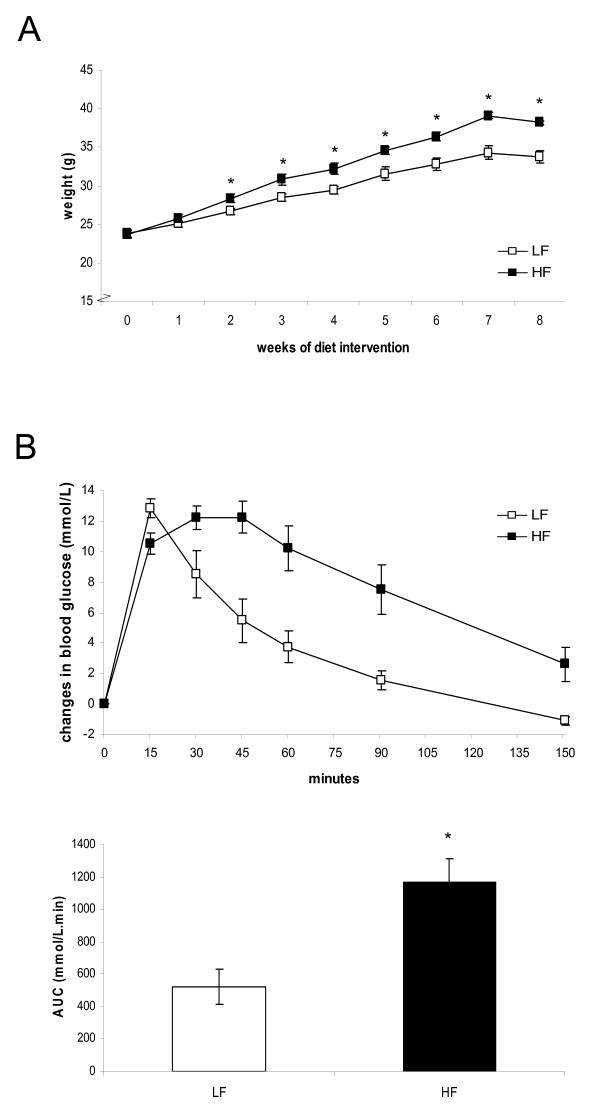
Methods: Male C57BL/6J mice were fed a low-fat or a high-fat diet that mimicked the fatty acid composition of a Western-style human diet. After 2, 4 and 8 weeks of diet intervention small intestines were isolated and divided in three equal parts. Differential gene expression was determined in mucosal scrapings using Mouse genome 430 2.0 arrays.

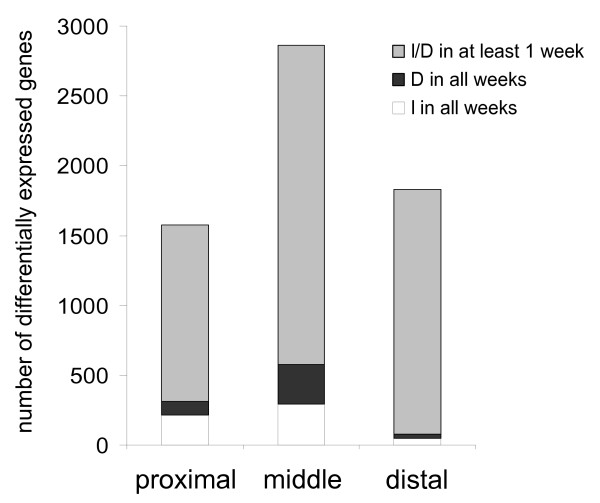
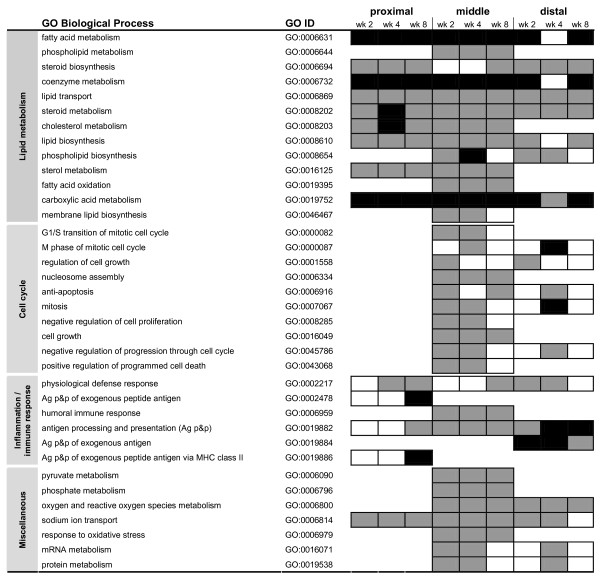
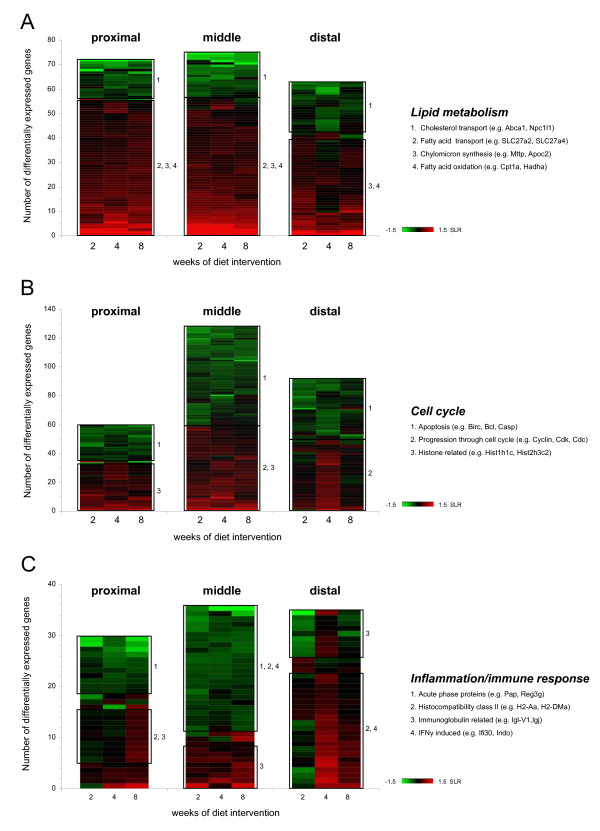
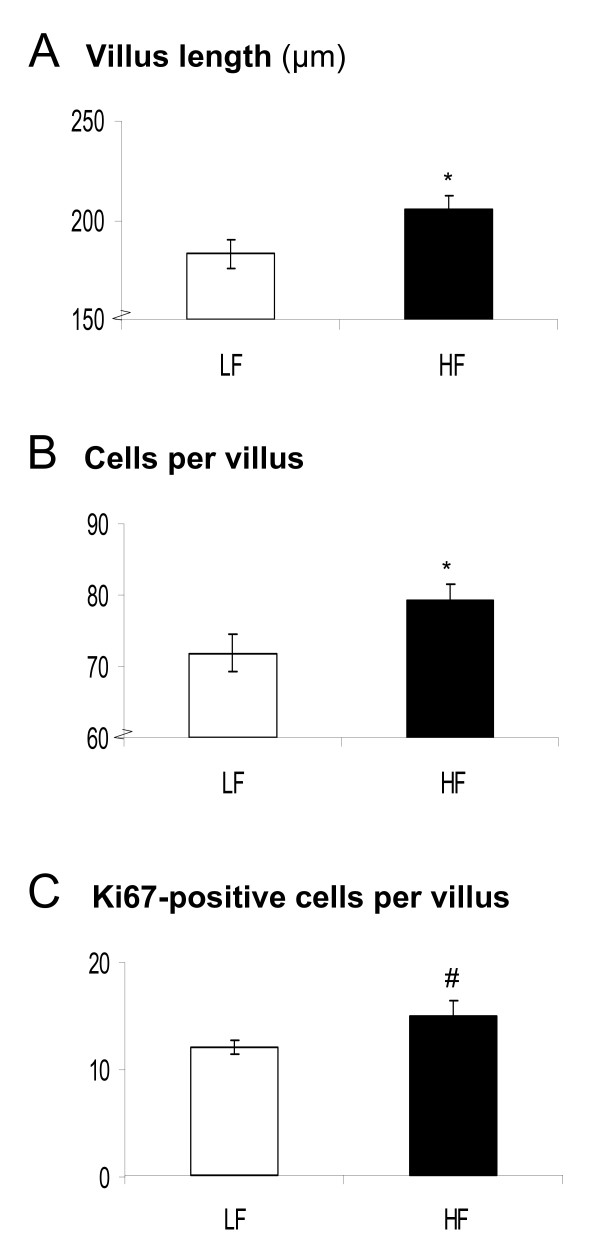
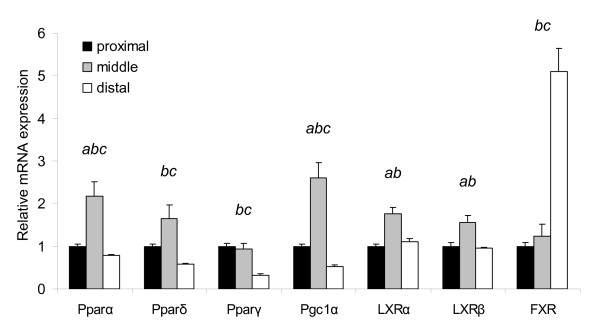
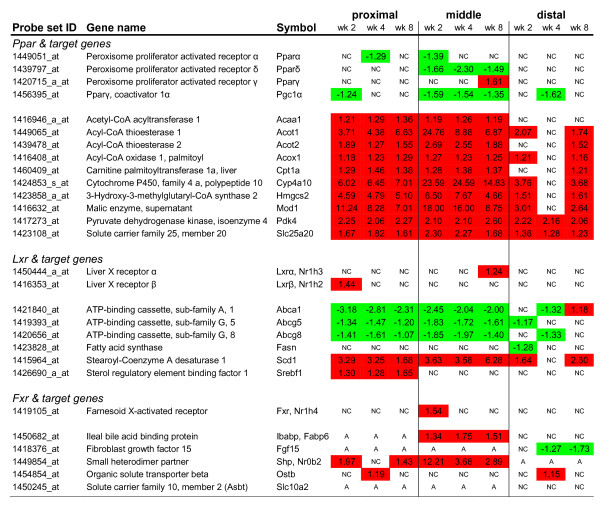
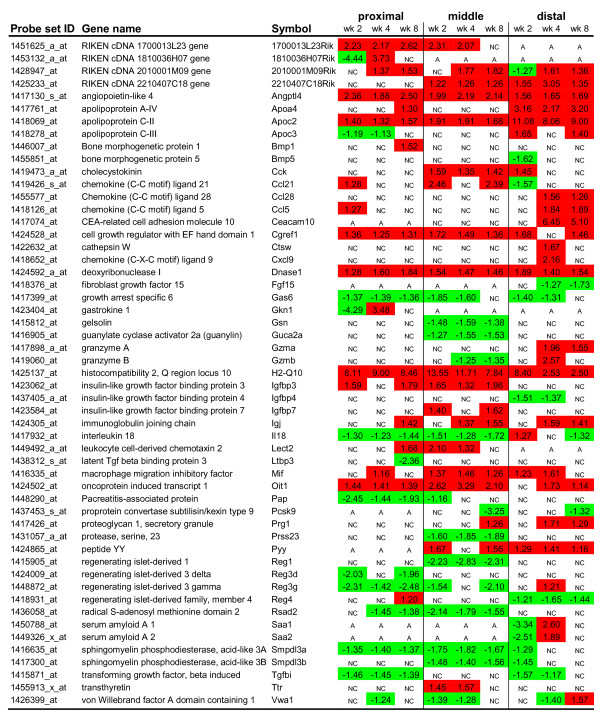
Results: The high-fat diet significantly increased body weight and decreased oral glucose tolerance, indicating insulin resistance. Microarray analysis showed that dietary fat had the most pronounced effect on differential gene expression in the middle part of the small intestine. By overrepresentation analysis we found that the most modulated biological processes on a high-fat diet were related to lipid metabolism, cell cycle and inflammation. Our results further indicated that the nuclear receptors Ppars, Lxrs and Fxr play an important regulatory role in the response of the small intestine to the high-fat diet. Next to these more local dietary fat effects, a secretome analysis revealed differential gene expression of secreted proteins, such as Il18, Fgf15, Mif, Igfbp3 and Angptl4. Finally, we linked the fat-induced molecular changes in the small intestine to development of obesity and insulin resistance.

Conclusion: During dietary fat-induced development of obesity and insulin resistance, we found substantial changes in gene expression in the small intestine, indicating modulations of biological processes, especially related to lipid metabolism. Moreover, we found differential expression of potential signaling molecules that can provoke systemic effects in peripheral organs by influencing their metabolic homeostasis. Many of these fat-modulated genes could be linked to obesity and/or insulin resistance. Together, our data provided various leads for a causal role of the small intestine in the etiology of obesity and/or insulin resistance.


Figures

Figure 1
Figure 1
Body weight and oral glucose tolerance test. (A) Body weight gain of C57BL/6J mice during a low-fat or high-fat diet intervention of 8 weeks. (B) An oral glucose tolerance test was performed after 7 weeks of diet intervention. After an oral gavage of 100 mg glucose, blood glucose levels were monitored for 150 minutes. The changes in blood glucose levels (upper figure) and the area under he curve were calculated (lower figure). In (A) and (B), data are means ± SE. * p < 0.05. LF = low-fat diet, HF = high-fat diet.
Figure 2
Figure 2
Dietary fat-induced differential gene expression along the longitudinal axis of the small intestine. For the proximal, middle and distal part of the small intestine, the numbers of genes that were differentially expressed in at least one week of diet intervention are plotted (grey bars). Among those are genes that were consistently up- (I) or down-regulated (D) on a high-fat diet (white and black bars, respectively).
Figure 3
Figure 3
Overrepresentation of GO Biological Process subsets in the small intestine during high-fat diet intervention. In the ORA analysis all genes showing differential expression in at least one week of diet intervention were included. For the proximal, middle and distal part of the small intestine, GO Biological Process subsets with a FDR < 0.01 and a RawScore = 10 in at least one week of diet intervention are considered significantly overrepresented. Black boxes indicate 1.0E-31 < FDR < 1.0E-08; dark grey boxes indicate 1.0E-08 < FDR < 0.01; white boxes indicate FDR > 0.01, so not significant. An empty row indicates that this part of small intestine did meet the above mentioned selection criteria (i.e. FDR > 0.01 at all time points).
Figure 4
Figure 4
Heat map diagrams of differentially expressed genes on a high-fat diet. SLR of differentially expressed genes related to lipid metabolism (A), cell cycle (B) and inflammation/immune response (C) are clustered in a heat map diagram for the proximal, middle and distal part of the small intestine. Green and red indicate down- and up-regulation of gene expression, respectively. In general, three expression patterns can be distinguished; consistently up-regulated, consistently down-regulated or alternate up- and down-regulation during diet intervention. Amongst other genes that display similar expression patterns on a high-fat diet, the boxes include differentially expressed genes that share association with particular biological processes (numbered). Differentially expressed genes with a -0.3 > SLR > 0.3 in at least one week of diet intervention were included and the color scheme ranges from SLR -1.5 to 1.5.
Figure 5
Figure 5
Dietary fat-induced cell proliferation in the small intestine, analyzed by immunohistochemistry. Immunohistochemistry was performed on distal small intestinal sections of C57BL/6J mice fed a low-fat or high-fat diet using Ki67-specific antibodies. Besides the villus length (A) and total number of villus cells (B), also the number of Ki67-positive cells per villus (C) were determined. Per mouse, 15 villi were counted and the mean values were calculated. * p < 0.05, # p = 0.07. LF = low-fat diet, HF = high-fat diet.
Figure 6
Figure 6
Relative mRNA expression of nuclear receptors along the longitudinal axis of the small intestine under basal conditions. For the proximal, middle and distal part of the small intestine, gene expression levels of Ppars, Lxrs and Fxr were determined after 2 weeks of low-fat diet intervention. qPCR data of the nuclear receptors are visualized as the mean expression of individual mice ± SE. Expression in the middle and distal part of the small intestine is relative to the expression in the proximal part, which was set to 1. a, b, and c indicate significant (p < 0.05, two-tailed Student's t test) differential gene expression between the distinct parts of the small intestine (a between the proximal and middle part, b between the middle and distal part and c between the proximal and distal part).
Figure 7
Figure 7
Dietary fat-induced differential expression of nuclear (hormone) receptors and their target genes in the small intestine. For the proximal, middle and distal part of the small intestine, differential gene expression (indicated by fold changes) of nuclear (hormone) receptors and their target genes was determined by microarray analysis, after 2, 4, and 8 weeks of high-fat diet intervention. Red and green boxes indicate a significant up- and down-regulation, respectively. NC = no change, A = absent.
Figure 8
Figure 8
Secretome analysis of differentially expressed genes in the small intestine during high-fat diet intervention. Secretome analysis was performed for the proximal, middle and distal part of the small intestine and included differentially expressed genes with fold changes < -1.5 and > +1.5 in at least one week of diet intervention. Red and green boxes indicate a significant up- and down-regulation, respectively. NC = no change, A = absent.

Similar articles

Cited by

References

    1. Moller DE, Kaufman KD. METABOLIC SYNDROME: A Clinical and Molecular Perspective. Annual Review of Medicine. 2005;56:45–62. doi: 10.1146/annurev.med.56.082103.104751. - DOI - PubMed
    1. Laaksonen DE, Niskanen L, Lakka HM, Lakka TA, Uusitupa M. Epidemiology and treatment of the metabolic syndrome. Ann Med. 2004;36:332–346. doi: 10.1080/07853890410031849. - DOI - PubMed
    1. Kahn BB, Flier JS. Obesity and insulin resistance. J Clin Invest. 2000;106:473–481. doi: 10.1172/JCI10842. - DOI - PMC - PubMed
    1. Winzell MS, Ahren B. The high-fat diet-fed mouse: a model for studying mechanisms and treatment of impaired glucose tolerance and type 2 diabetes. Diabetes. 2004;53 Suppl 3:S215–9. doi: 10.2337/diabetes.53.suppl_3.S215. - DOI - PubMed
    1. Kondo H, Minegishi Y, Komine Y, Mori T, Matsumoto I, Abe K, Tokimitsu I, Hase T, Murase T. Differential regulation of intestinal lipid metabolism-related genes in obesity-resistant A/J vs. obesity-prone C57BL/6J mice. Am J Physiol Endocrinol Metab. 2006;291:E1092–1099. doi: 10.1152/ajpendo.00583.2005. - DOI - PubMed