. 2008 Jun;172(6):1529-41.
doi: 10.2353/ajpath.2008.070429. Epub 2008 May 5.

Endogenous hydrogen peroxide regulates glutathione redox via nuclear factor erythroid 2-related factor 2 downstream of phosphatidylinositol 3-kinase during muscle differentiation

Affiliations

Endogenous hydrogen peroxide regulates glutathione redox via nuclear factor erythroid 2-related factor 2 downstream of phosphatidylinositol 3-kinase during muscle differentiation

Yan Ding et al. Am J Pathol. 2008 Jun.

Abstract

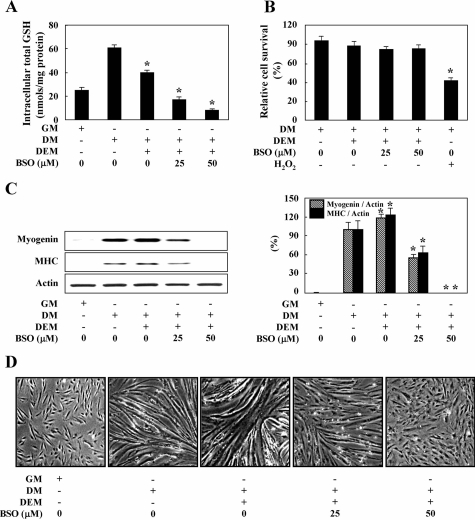
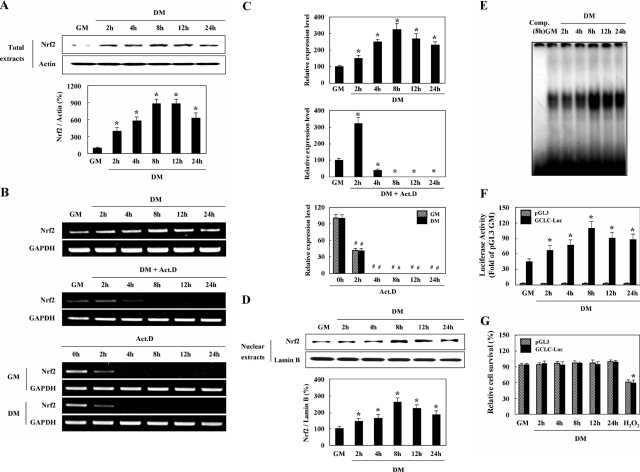
We reported previously that endogenous reactive oxygen species (ROS) function as myogenic signaling molecules. It has also been determined that excess ROS induce electrophile-response element (EpRE)-driven gene expression via activation of nuclear factor erythroid 2-related factor 2 (Nrf2). Nonetheless, the relationship between the metabolism of ROS (eg, H(2)O(2)) through glutathione (GSH) up-regulation, GSH-dependent reduction of H(2)O(2), and Nrf2-dependent gene regulation is not well established. Therefore, we attempted to determine whether H(2)O(2) controls the intracellular GSH redox state via the Nrf2-glutamate-cysteine ligase (GCL)/glutathione reductase (GR)-GSH signaling pathway. In our experiments, enhanced H(2)O(2) generation was accompanied by an increase in both total GSH levels and the GSH/GSSG ratio during muscle differentiation. Both GCL and GR transcriptional expression levels were markedly increased during muscle differentiation but reduced by catalase treatment. Nrf2 protein expression and nuclear translocation increased during myogenesis. The inhibition of GCL, GR, and Nrf2 both by inhibitors and by RNA interference blocked muscle differentiation. Phosphatidylinositol 3-kinase regulated the expression of the GCL C (a catalytic subunit) and GR genes via the induction of Nrf2 nuclear translocation and expression. In conclusion, endogenous H(2)O(2) generated during muscle differentiation not only functions as a signaling molecule, but also regulates the GSH redox state via activation of the Nrf2-GCL/GR-GSH signaling pathway downstream of phosphatidylinositol 3-kinase.


Figures

Figure 1
Figure 1
ROS generation and intracellular GSH redox changes during muscle differentiation. H9c2 cells were grown in GM or further incubated in DM for the indicated time periods. A: DCF-DA and Hoechst 33342 were added to each group of cells, and ROS generation was observed via confocal microscopy. Nuclei were stained with Hoechst 33342. B–D: Samples were prepared from cells incubated in GM or DM for the indicated time periods, and the intracellular total GSH (B) and GSSG levels (C) and the GSH/GSSG ratio (D) were determined. The data are expressed as the means ± SE of at least three independent experiments. *P < 0.05, versus cells in GM. h and d are hours and days after the induction of differentiation. Scale bars = 20 μm. Original magnifications, ×40.
Figure 2
Figure 2
GCL inhibition impairs myogenesis. Cells in DM were treated with 50 μmol/L DEM for 20 minutes followed by the indicated doses of BSO. The intracellular total GSH levels (A) and MTT activity (B) were assessed as described in the Materials and Methods section. The addition of 100 μmol/L H2O2 in DM was used as a positive control. Differentiation was evaluated via the expression of differentiation markers by Western blotting (C, left) and densitometric (C, right) analysis, and morphological changes with photomicrographs (D) after incubation in DM in the absence or presence of DEM and BSO. Actin was used as a loading control. The data are expressed as the means ± SE of at least three independent experiments. *P < 0.05, versus untreated cells in DM. Original magnifications, ×20.
Figure 3
Figure 3
Inhibition of GR impairs myogenesis. Cells in DM were treated with the indicated doses of BCNU to inhibit GR activity. The intracellular total GSH levels (A), GSSG levels (B), GSH/GSSG ratio (C), and MTT activity assays (D) were assessed. H2O2 in DM was used as a positive control. Differentiation was evaluated via the expression of differentiation markers by Western blotting (E, left) and densitometric (E, right) analysis, and morphological changes with photomicrographs (F) after incubation in DM in the absence or presence of BCNU. Actin was used as a loading control. The data are expressed as the means ± SE of at least three independent experiments. *P < 0.05, versus untreated cells in DM. Original magnifications, ×20.
Figure 4
Figure 4
Knockdown of GCLC and GR impairs myogenesis. Cells transfected with shRNA or siRNA specific to GCLC or GR were induced to differentiate in DM. The expression levels of GCLC and GR were determined via Western blotting (A and B, left) and densitometric (A and B, right) analysis. Differentiation was evaluated by the expression of differentiation markers by Western blotting (C, left) and densitometric (C, right) analysis as well as morphological changes with photomicrographs (D) after switching to DM. GFP-shRNA and scrambled-siRNA were used as negative controls for these knockdown experiments. Actin was used as a loading control. The data are expressed as the means ± SE of at least three independent experiments. *P < 0.05, versus cells transfected with GFP-shRNA or scrambled-siRNA in DM. Original magnifications, ×20.
Figure 5
Figure 5
Induction of GCLC and GR during muscle differentiation. A and B: Proliferating cells in GM were induced to differentiate for the indicated time periods in DM. The expression patterns of GCLC and GR were determined via Western blotting (A, top), semiquantitative RT-PCR (B, top), and densitometric (A and B, bottom) analysis. Differentiation was evaluated by measuring the expression of myogenin and MHC. The protein sample from rat kidney tissue (3 μg) was loaded as a size marker of GCLC and GR (Con). C: Confluent cells were incubated in GM or further exposed to DM with actinomycin D (5 μg/ml) for the indicated time periods, and semiquantitative RT-PCR analysis was conducted (C, top). Cells incubated in DM for 24 hours were again exposed to GM or DM with actinomycin D, and the mRNA levels of GCLC and GR were determined via semiquantitative RT-PCR analysis (C, bottom). D: Confluent cells were incubated in DM in the absence or presence of catalase and Western blotting analysis was conducted. E and F: Proliferating cells in GM were induced to differentiate for the indicated time periods in DM. The patterns of Mn-SOD expression were determined via Western blotting (E, top), semiquantitative RT-PCR (F, top), and densitometric (E and F, bottom) analysis. Actin and GAPDH were used as loading controls. The data are representative of at least three different experiments and are expressed as the means ± SE. *P < 0.05, versus cells in GM.
Figure 6
Figure 6
Nrf2 is transcriptionally up-regulated and translocated to the nucleus during myogenesis. A–C: Cells were cultured in GM or DM for the indicated time periods. Expression patterns of total Nrf2 protein were determined via Western blotting (A, top) and densitometric (A, bottom) analysis, and those of Nrf2 mRNA were determined via semiquantitative (B, top) and real-time quantitative (C, top) RT-PCR analysis. In addition, confluent cells were incubated in GM or further exposed to DM with actinomycin D (5 μg/ml) for the indicated time periods, and semiquantitative (B, middle) and real-time quantitative (C, middle) RT-PCR analysis was conducted. Furthermore, cells exposed to DM for 8 hours were incubated in GM or DM with actinomycin D, and the levels of Nrf2 mRNA were determined via semiquantitative (B, bottom) and real-time quantitative (C, bottom) RT-PCR analysis. D: Nuclear extracts were assessed via Western blotting (D, top) and densitometric (D, bottom) analysis. Lamin B was identified as a nuclear protein marker. E: Nuclear fractions were prepared from each sample and EMSA analysis was conducted using the EpRE consensus sequence. The first lane represents competition with 100× unlabeled probe. F and G: Cells were transiently transfected with the pGL3 enhancer vector (pGL3) or the GCLC promoter-luciferase construct (GCLC-Luc) and further incubated in GM or DM for the indicated time periods. The data are expressed in terms of luciferase activity (F) and MTT activity (G), as compared with those of pGL-3 enhancer vector-transfected cells in GM. G: The addition of 100 μmol/L H2O2 in DM was used as a positive control. The data are representative of at least three different experiments and are expressed as the means ± SE. *P < 0.05 versus cells in GM. #P < 0.05 versus untreated cells in GM or DM.
Figure 7
Figure 7
Role of Nrf2 in GCLC and GR induction during muscle differentiation. Cells transfected with siRNA specific to Nrf2 were incubated for 24 hours in GM (A, left) or DM (A, right). A: Total cell lysates were assessed via Western blotting analysis. Differentiation was evaluated by the expression of differentiation markers with Western blotting analysis (B), morphological changes with photomicrographs (C), and an MCK-dependent luciferase assay (D). The intracellular total GSH (E) and ROS (F) levels, as well as the MTT assay (G) were assessed after Nrf2 knockdown. Scrambled-siRNA was used as a negative control for knockdown and FLIP knockdown was used as a positive control for MTT assay. Data represent the means ± SE of at least three independent experiments. *P < 0.05 versus cells transfected with scrambled-siRNA in GM. #P < 0.05 versus cells transfected with scrambled-siRNA in DM. Original magnifications, ×20.
Figure 8
Figure 8
PI 3-kinase is involved in the Nrf2 pathway during muscle differentiation. A: After 8 hours of treatment with LY294002 or LY303511 in DM, the nuclear extracts were assessed via Western blotting (A, top) and densitometric (A, bottom) analysis. B: After treatment with the indicated doses of LY294002 or LY303511 in DM, the total extracts were assessed via Western blotting analysis. Actin was used as a loading control. C and D: In the two clones (1 and 2) of mock and Δp85 transfectants, nuclear extracts were analyzed via Western blotting analysis to observe Nrf2 translocation in GM or in DM for 8 hours (C). After mock and Δp85 transfectants were cultivated in GM or DM for 24 hours, Western blotting analysis was conducted (D). Mock transfectants were used as negative controls. E and F: Cells were treated for 24 hours with LY294002 or LY303511 in DM and the intracellular (E) and extracellular (F) total GSH content was measured. The data are expressed as the means ± SE of at least three independent experiments. *P < 0.05, versus untreated cells. G: After treatment with 20 μmol/L of SB203580 or PD98059 for 8 (top) or 24 (bottom) hours in DM, the nuclear or total extracts were assessed via Western blotting analysis.

Similar articles

Cited by

References

    1. Lynch GS, Schertzer JD, Ryall JG. Therapeutic approaches for muscle wasting disorders. Pharmacol Ther. 2007;113:461–487. - PubMed
    1. Seale P, Rudnicki MA. A new look at the origin, function, and “stem-cell” status of muscle satellite cells. Dev Biol. 2000;218:115–124. - PubMed
    1. Lim MJ, Choi KJ, Ding Y, Kim JH, Kim BS, Kim YH, Lee J, Choe W, Kang I, Ha J, Yoon KS, Kim SS. RhoA/Rho kinase blocks muscle differentiation via serine phosphorylation of insulin receptor substrate-1 and -2. Mol Endocrinol. 2007;21:2282–2293. - PubMed
    1. Gonzalez I, Tripathi G, Carter EJ, Cobb LJ, Salih DA, Lovett FA, Holding C, Pell JM. Akt2, a novel functional link between p38 mitogen-activated protein kinase and phosphatidylinositol 3-kinase pathways in myogenesis. Mol Cell Biol. 2004;24:3607–3622. - PMC - PubMed
    1. Latres E, Amini AR, Amini AA, Griffiths J, Martin FJ, Wei Y, Lin HC, Yancopoulos GD, Glass DJ. Insulin-like growth factor-1 (IGF-1) inversely regulates atrophy-induced genes via the phosphatidylinositol 3-kinase/Akt/mammalian target of rapamycin (PI3K/Akt/mTOR) pathway. J Biol Chem. 2005;280:2737–2744. - PubMed

Publication types

MeSH terms