

Gene-centric genomewide association study via entropy
- PMID: 18458106
- PMCID: PMC2390640
- DOI: 10.1534/genetics.107.082370
Gene-centric genomewide association study via entropy
Abstract
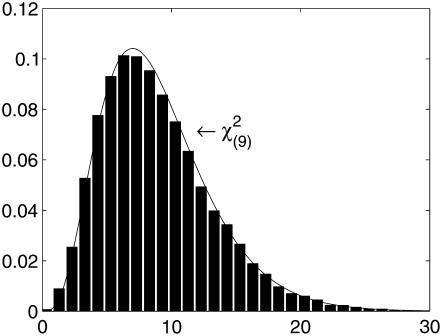
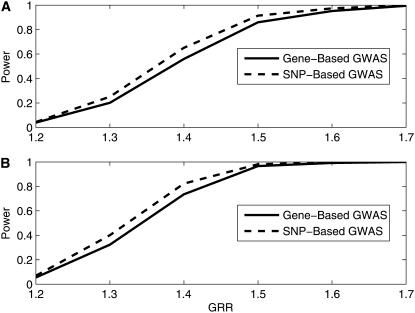
Genes are the functional units in most organisms. Compared to genetic variants located outside genes, genic variants are more likely to affect disease risk. The development of the human HapMap project provides an unprecedented opportunity for genetic association studies at the genomewide level for elucidating disease etiology. Currently, most association studies at the single-nucleotide polymorphism (SNP) or the haplotype level rely on the linkage information between SNP markers and disease variants, with which association findings are difficult to replicate. Moreover, variants in genes might not be sufficiently covered by currently available methods. In this article, we present a gene-centric approach via entropy statistics for a genomewide association study to identify disease genes. The new entropy-based approach considers genic variants within one gene simultaneously and is developed on the basis of a joint genotype distribution among genetic variants for an association test. A grouping algorithm based on a penalized entropy measure is proposed to reduce the dimension of the test statistic. Type I error rates and power of the entropy test are evaluated through extensive simulation studies. The results indicate that the entropy test has stable power under different disease models with a reasonable sample size. Compared to single SNP-based analysis, the gene-centric approach has greater power, especially when there is more than one disease variant in a gene. As the genomewide genic SNPs become available, our entropy-based gene-centric approach would provide a robust and computationally efficient way for gene-based genomewide association study.
Figures


References
-
- Anteby, E. Y., C. Greenfield, S. Natanson-Yaron, D. Goldman-Wohl, Y. Hamani et al., 2004. Vascular endothelial growth factor, epidermal growth factor and fibroblast growth factor-4 and -10 stimulate trophoblast plasminogen activator system and metalloproteinase-9. Mol. Hum. Reprod. 10 229–235. - PubMed
-
- Benjamini, Y., and Y. Hochberg, 1995. Controlling the false discovery rate: a practical and powerful approach to multiple testing. J. R. Stat. Soc. Ser. B 57 289–300.
-
- Conley, Y. P., A. Thalamuthu, J. Jacobsdottir, D. E. Weeks, T. Mah et al., 2005. Candidate gene analysis suggests a role for fatty acid biosynthesis and regulation of the complement system in the etiology of age-related maculopathy. Hum. Mol. Genet. 14 1991–2002. - PubMed
-
- Cover, T. M., and J. A. Thomas, 1991. Elements of Information Theory, pp. 12–15. Wiley, New York.
Publication types
MeSH terms
Grants and funding
LinkOut - more resources
Full Text Sources
Medical
Research Materials
