. 2008 May 12;205(5):1227-42.
doi: 10.1084/jem.20071460. Epub 2008 May 5.

ATF4 is an oxidative stress-inducible, prodeath transcription factor in neurons in vitro and in vivo

Affiliations

ATF4 is an oxidative stress-inducible, prodeath transcription factor in neurons in vitro and in vivo

Philipp S Lange et al. J Exp Med. .

Abstract

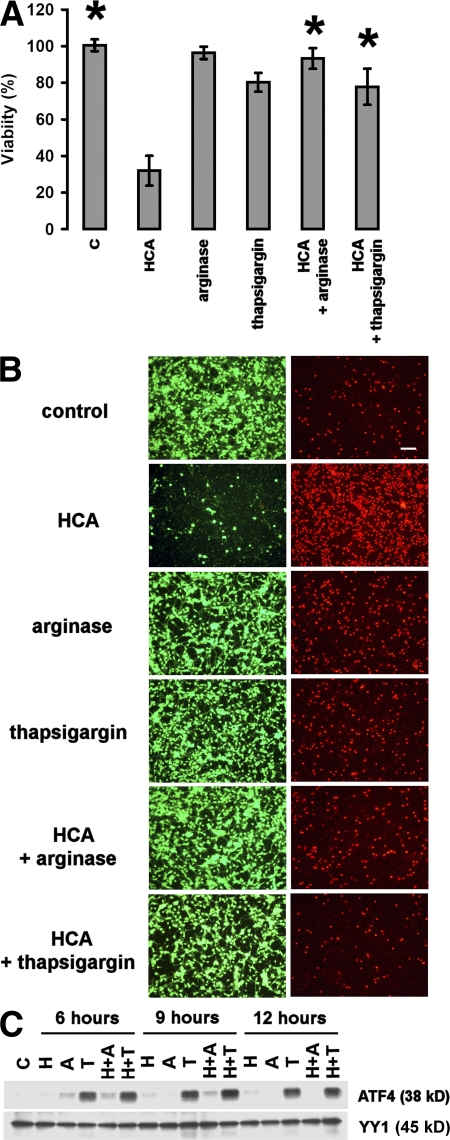
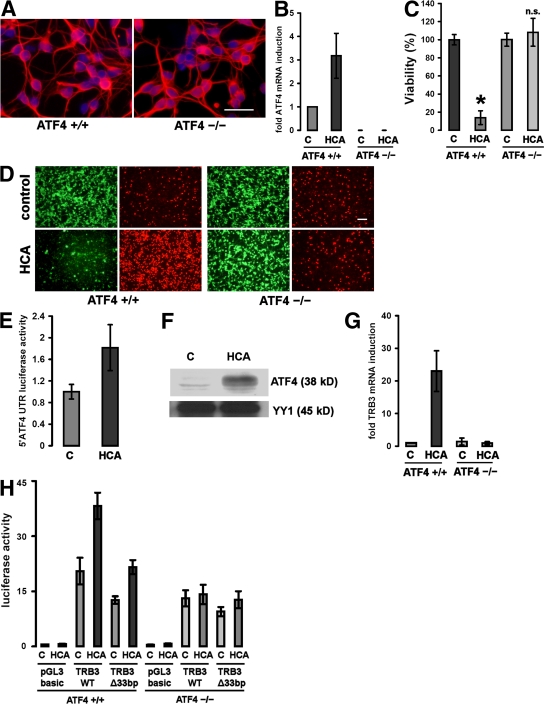
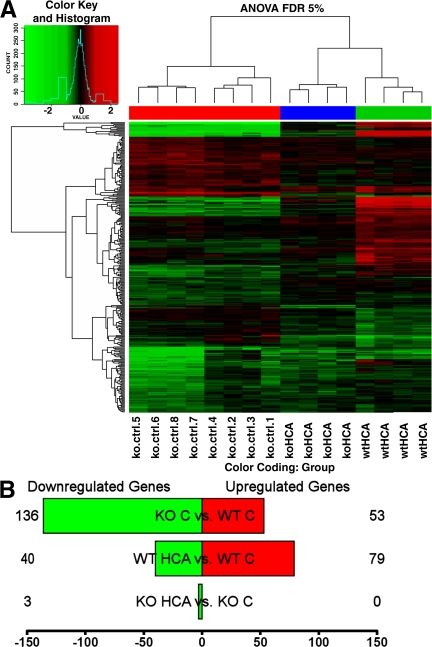
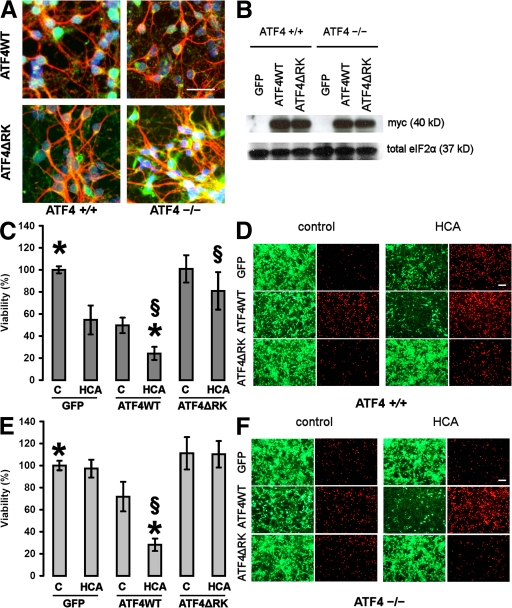
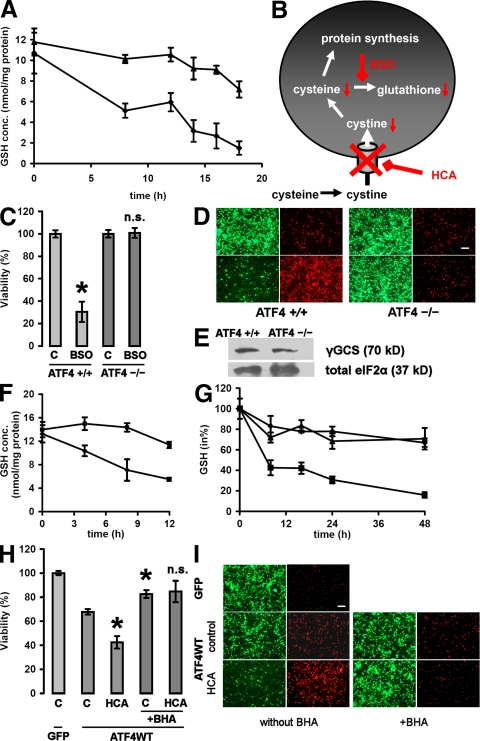
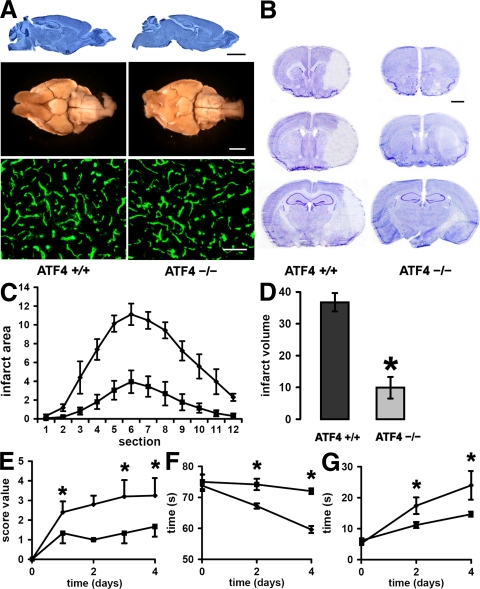
Oxidative stress is pathogenic in neurological diseases, including stroke. The identity of oxidative stress-inducible transcription factors and their role in propagating the death cascade are not well known. In an in vitro model of oxidative stress, the expression of the bZip transcription factor activating transcription factor 4 (ATF4) was induced by glutathione depletion and localized to the promoter of a putative death gene in neurons. Germline deletion of ATF4 resulted in a profound reduction in oxidative stress-induced gene expression and resistance to oxidative death. In neurons, ATF4 modulates an early, upstream event in the death pathway, as resistance to oxidative death by ATF4 deletion was associated with decreased consumption of the antioxidant glutathione. Forced expression of ATF4 was sufficient to promote cell death and loss of glutathione. In ATF4(-/-) neurons, restoration of ATF4 protein expression reinstated sensitivity to oxidative death. In addition, ATF4(-/-) mice experienced significantly smaller infarcts and improved behavioral recovery as compared with wild-type mice subjected to the same reductions in blood flow in a rodent model of ischemic stroke. Collectively, these findings establish ATF4 as a redox-regulated, prodeath transcriptional activator in the nervous system that propagates death responses to oxidative stress in vitro and to stroke in vivo.


Figures

Figure 1.
Figure 1.
Amino acid depletion and thapsigargin treatment induce ATF4 and protect embryonic cortical neurons from oxidative stress–induced cell death. (A) Cortical neuronal cultures (1 d in vitro) were treated with a vehicle control (shown as C), 10 mM of the glutamate analogue HCA, 1 μg/ml arginase, 1 μM thapsigargin, 1 μg/ml arginase and 10 mM HCA, or 10 mM HCA and 1 μM thapsigargin. 24 h later, cell viability was determined using the MTT assay. The graph depicts mean (compared with control) ± SD calculated from three separate experiments for each group (n = 25). *, P < 0.05 from HCA-treated cultures by the Kruskal-Wallis test followed by Dunn's multiple comparisons test. (B) Live/dead assay of cortical neuronal cultures (2 d in vitro). Live cells were detected by uptake and trapping of calcein-AM (green fluorescence). Dead cells failed to trap calcein but were freely permeable to the highly charged DNA intercalating dye ethidium homodimer (red fluorescence). Bar, 50 μm. (C) Treatment with 10 mM HCA (shown as H) and 1 μg/ml arginase (shown as A) or 1 μM thapsigargin (shown as T), alone or in combination with HCA, increases the expression of ATF4 in cultured cortical neurons as compared with vehicle-treated control (shown as C). Cells were harvested at the indicated time points, and nuclear extracts were separated using gel electrophoresis and immunodetected using an antibody against ATF4. YY1 was monitored as a loading control. The immunoblot is a representative example of three experiments.
Figure 2.
Figure 2.
Cortical neurons from ATF4−/− brains are resistant to oxidative stress–induced cell death. (A) Immunocytochemistry of cultured ATF4+/+ and ATF4−/− cortical neurons. Cells were stained with an antibody against MAP2 (which stains neural dendrites; red) and counterstained with Hoechst (blue). Bar, 50 μm. (B) Real-time PCR of ATF4 mRNA expression in ATF4+/+ and ATF4−/− neurons in response to treatment with 10 mM HCA. The value obtained from the ATF4+/+ control was arbitrarily defined as 1. Mean ± SD was calculated from three separate experiments. Each data point was performed in duplicate. (C) Cortical neuronal cultures (1 d in vitro) prepared from brains from ATF4+/+ and ATF4−/− embryos were treated with a vehicle control (shown as C) or 10 mM HCA. 24 h later, cell viability was determined using the MTT assay. The graph depicts mean (compared with control) ± SD calculated from data from five separate experiments (n = 27 ATF4+/+ and 73 ATF4−/−). *, P < 0.05 from ATF4+/+ untreated cultures by the Kruskal-Wallis test followed by Dunn's multiple comparisons test. The difference between treated and untreated ATF4−/− neurons was not significant (n.s.). (D) Representative live/dead assay displaying untreated and HCA-treated ATF4+/+ and ATF4−/− neurons. Bar, 50 μm. (E) ATF4+/+ neurons were transfected with a reporter plasmid (pGL3 backbone) containing the mouse ATF4 5′UTR and AUG fused to luciferase. Cortical neurons were cotransfected with a plasmid expressing Renilla to allow normalization for transfection efficiency. 24 h after transfection, neurons were treated with vehicle control (shown as C) or 10 mM HCA. Cells were harvested in luciferase assay buffer 12 h after the onset of treatment. Values were calculated from three separate experiments and are given as the ratio of luciferase and Renilla activities (mean ± SD; n = 3). The value for treatment with vehicle control was arbitrarily defined as 1. (F) Oxidative stress results in nuclear accumulation of ATF4 in cultured cortical neurons. 60 μg of nuclear extracts from cortical neurons treated with 10 mM HCA or vehicle control (shown as C) were separated using gel electrophoresis and immunodetected using an antibody against ATF4. YY1 was monitored as a loading control. (G) Real-time PCR of TRB3 mRNA expression in ATF4+/+ and ATF4−/− neurons in response to treatment with 10 mM HCA. The value obtained from the ATF4+/+ control was arbitrarily defined as 1. Mean ± SD was calculated from three separate experiments. Each data point was performed in duplicate. (H) ATF4+/+ and ATF4−/− neurons were transfected with a luciferase reporter plasmid (pGL3 backbone) containing a 2-kb fragment of the mouse TRB3 promoter (TRB3WT), with a mutant version of this promoter lacking the 33-bp ATF4 binding site (TRB3Δ33bp) or with the empty vector (pGL3 basic). Cortical neurons were cotransfected with a plasmid expressing Renilla to allow normalization for transfection efficiency. 24 h after transfection, neurons were treated with vehicle control (shown as C) or 10 mM HCA. Cells were harvested in luciferase assay buffer 12 h after the onset of treatment. Values are given as the ratio of luciferase and Renilla activities (mean ± SD) and were calculated from three separate experiments. Each data point was performed in duplicate. Values are given as the ratio of luciferase and Renilla activities (mean ± SD; n = 3). The value for empty pGL3 was arbitrarily defined as 1.
Figure 3.
Figure 3.
Gene expression array analysis of ATF4+/+ and ATF4−/− neurons before and after treatment with HCA. (A) Heatmap with cluster dendrogram of the differentially expressed genes (log2 fold change vs. control) at a false discovery rate of 5%. Unsupervised clustering groups samples by genotype and by treatment. Genes are in rows and samples are in columns. Column color coding is as follows: red, ATF4−/− versus ATF4+/+ untreated neurons; blue, HCA-treated ATF4−/− versus untreated ATF4−/− neurons; and green, HCA-treated ATF4+/+ versus untreated ATF4+/+ neurons. (B) The number of genes that are up- (red) and down-regulated (green). Shown are three different contrasts: ATF4−/− versus ATF4+/+ untreated neurons, HCA-treated ATF4+/+ versus untreated ATF4+/+ neurons, and HCA-treated ATF4−/− versus untreated ATF4−/− neurons. The complete list of differentially expressed genes is available in Table S3 (available at http://www.jem.org/cgi/content/full/jem.20071460/DC1). ANOVA FDR, analysis of variance false discovery rate; C, control.
Figure 4.
Figure 4.
ATF4 binds to a 33-bp binding element within the TRB3 promoter. (A) EMSA performed with 10 μg of dialyzed nuclear extracts from HT22 cells transfected with ATF4WT, mutant ATF4 (ATF4ΔRK), or GFP, respectively. Extracts were incubated with a radioactively labeled WT oligonucleotide containing the TRB3 promoter binding site or with a mutant oligonucleotide. Binding of ATF4WT to the TRB3WT promoter binding site was confirmed by supershift analysis (arrow) performed with an antibody (Ab) directed against ATF4. (B) Overexpressed ATF4WT protein occupies its putative binding site within the TRB3 promoter in HT22 cells, as shown by chromatin immunoprecipitation assay. HT22 cells were transfected with ATF4WT, mutant ATF4 (ATF4ΔRK), or GFP. An anti-myc antibody was used to precipitate the proteins in nuclear extracts of cross-linked HT22 cells. Coprecipitated DNA fragments were detected using PCR with a set of primers specific for the ATF4 binding site in the TRB3 promoter, yielding a 190-bp product. A representative example of three experiments is shown. (C) HT22 cells were transfected with the expression plasmids for ATF4WT, mutant ATF4 (ATF4ΔRK), or GFP. The cells were cotransfected with either a luciferase reporter vector containing the 33-bp ATF4WT binding site (33 bp WT), a reporter vector containing a mutant form of this binding site (33 bp MUT), or empty vector (pGL3 basic). In parallel, the transfection mix contained a plasmid expressing Renilla to allow normalization for transfection efficiency. The value for empty pGL3 cotransfected with GFP was arbitrarily defined as 1. Shown are ratios of luciferase and Renilla activities (mean ± SD for three independent experiments; each data point was performed in duplicate).
Figure 5.
Figure 5.
Overexpression of ATF4WT restores sensitivity to oxidative stress and reduces neuronal viability itself. (A) Representative immunocytochemistry of ATF4+/+ and ATF4−/− cortical neurons infected with the adenoviral constructs ATF4WT and ATF4ΔRK. Neurons were stained with antibodies against myc (green) and MAP2 (red), and were counterstained with Hoechst dye (blue). Bar, 50 μm. (B) Whole-cell extracts obtained from both ATF4+/+ and ATF4−/− neurons infected with GFP, ATF4WT, and ATF4ΔRK were separated using gel electrophoresis and immunodetected using an antibody directed against the myc tag. Total eIF2α was monitored as a loading control. (C) ATF4+/+ cortical neurons were infected with GFP, ATF4WT, and ATF4ΔRK adenoviruses at an MOI of 100. 24 h after infection, neurons were treated with vehicle control (shown as C) or 10 mM HCA. 24 h later, cell viability was determined using the MTT assay. The graph depicts mean (compared with control) ± SD calculated from four separate experiments for each group (n = 45). P < 0.05 by the Kruskal-Wallis test followed by Dunn's multiple comparisons test from untreated ATF4WT-overexpressing neurons (*) and from HCA-treated neurons overexpressing GFP (§). (D) Live/dead assay. Bar, 50 μm. (E) ATF4−/− cortical neurons were infected with GFP, ATF4WT, and ATF4ΔRK adenoviruses at an MOI of 100. 24 h after infection, neurons were treated with vehicle control (shown as C) or 10 mM HCA. 24 h later, cell viability was determined using the MTT assay. The graph depicts mean (compared with control) ± SD calculated from four separate experiments for each group (n = 28). P < 0.05 by the Kruskal-Wallis test followed by Dunn's multiple comparisons test from untreated ATF4WT-overexpressing neurons (*) and from HCA-treated neurons overexpressing GFP (§). (F) Live/dead assay. Bar, 50 μm.
Figure 6.
Figure 6.
ATF4 has a negative impact on the neuronal glutathione metabolism. (A) ATF4+/+ (♦) and ATF4−/− (▴) cortical neurons were treated with 10 mM HCA. At the indicated time points, cells were trypsinized, washed, and pelleted. Reduced glutathione (GSH) was determined in the cell pellets using HPLC electrochemical detection. Data are from three separate cultures, and each data point was measured in duplicate. Graph depicts mean ± SD. (B) Schematic overview over cysteine uptake and glutathione synthesis and their inhibition. (C) ATF4+/+ and ATF4−/− cortical neurons were treated with a vehicle control (shown as C) or 200 μM BSO. 24 h later, cell viability was determined using the MTT assay. The graph depicts mean (compared with control) ± SD calculated from five separate experiments for each group (n = 46 ATF4+/+ and 58 ATF4−/−). *, P < 0.05 from untreated ATF4+/+ cultures by the Kruskal-Wallis test followed by Dunn's multiple comparisons test. The difference between treated and untreated ATF4−/− neurons was not significant (n.s.). (D) Live/dead assay displaying untreated and BSO-treated ATF4+/+ and ATF4−/− neurons. Bar, 50 μm. (E) Protein expression of γ-GCS does not differ between ATF4+/+ and ATF4−/− cortical neurons. Cytoplasmic extracts were separated using gel electrophoresis and immunodetected using an antibody against γ-GCS. Total eIF2α was monitored as a loading control. (F) ATF4+/+ (♦) and ATF4−/− (▪) cortical neurons were treated with 200 μM BSO. At the indicated time points, cells were trypsinized, washed, and pelleted. GSH was determined in the cell pellets using HPLC electrochemical detection. Data are from three separate cultures, and each data point was measured in duplicate. Graph depicts mean ± SD. (G) ATF4+/+ cortical neurons were infected with GFP (♦), ATF4WT (▪), and ATF4ΔRK (▴) adenoviruses at an MOI of 100. At the indicated time points after infection, cells were trypsinized, washed, and pelleted. GSH was determined in the cell pellets using HPLC electrochemical detection. The graph depicts mean ± SD calculated from three separate experiments for each group, and each data point was measured in duplicate. The value obtained from noninfected neurons was arbitrarily defined as 100%. (H) ATF4+/+ cortical neurons were infected with GFP and ATF4WT adenoviruses at an MOI of 100. 24 h after infection, neurons were treated with vehicle control (shown as C), 10 mM HCA, 10 μM BHA, or a combination of both. The graph depicts mean (compared with control) ± SD calculated from five separate experiments for each group (n = 29). *, P < 0.05 from untreated neurons overexpressing ATF4WT by the Kruskal-Wallis test followed by Dunn's multiple comparisons test. The difference between neurons overexpressing ATF4WT treated with BHA alone and neurons overexpressing ATF4WT treated with both BHA and HCA was not significant (n.s.). (I) Live/dead assay. Bar, 50 μm.
Figure 7.
Figure 7.
Role of ATF4 in brain ischemia. (A, top) Sagittal sections of ATF4+/+ (left) and ATF4−/− (right) brains stained with cresyl violet. Bar, 3,000 μm. (A, middle) Ventral view of large cerebral blood vessels of representative ATF4+/+ (left) and ATF4−/− (right) mice that were perfused with India ink. Note the higher degree of tortuosity of the MCA in the brain from the ATF4−/− mouse. Bar, 3,000 μm. (A, bottom) Representative microscopic views of brain sections from ATF4+/+ and ATF4−/− mice that were immunostained for the endothelial cell–specific marker CD31 (green). Bar, 100 μm. (B) Representative brain sections at 4 d after MCAo from ATF4+/+ (n = 5) and ATF4−/− (n = 6) mice from rostral to caudal stained with cresyl violet to determine the infarct area. Bar, 1,000 μm. (C) The infarct area in ATF4+/+ (♦) and ATF4−/− (▪) brains was measured in 12 sequential sections taken from ATF4+/+ (n = 5) and ATF4−/− (n = 6) mice at rostral to caudal regular intervals. Graph depicts mean ± SD. (D) The infarct volume was assessed by adding the infarct volumes based on the infarct area in each section. Graph depicts mean ± SD. *, P < 0.0001 by the t test. (E) Scoring of neurological deficit was assessed at different time points of recovery in ATF4+/+ (n = 5) and ATF4−/− (n = 4) mice. Graph depicts mean ± SD. *, P < 0.05 by the Mann-Whitney test. (F) Inclined plane test at different time points after stroke in ATF4+/+ (n = 5) and ATF4−/− (n = 4) mice. The test measured the time a mouse managed to hold itself on an inclined glass plate angled at 50° before sliding down. Graph depicts mean ± SD. *, P < 0.05 by the t test. (G) Hanging wire test at different time points after stroke in ATF4+/+ (n = 5) and ATF4−/− (n = 4) mice. The hanging wire test determined the time it took an animal to cross a distance of 45 cm on a freely hanging narrow metal bar. Graph depicts mean ± SD. *, P < 0.05 by the t test.

Similar articles

Cited by

References

    1. Droge, W. 2002. Free radicals in the physiological control of cell function. Physiol. Rev. 82:47–95. - PubMed
    1. Cullinan, S.B., and J.A. Diehl. 2006. Coordination of ER and oxidative stress signaling: the PERK/Nrf2 signaling pathway. Int. J. Biochem. Cell Biol. 38:317–332. - PubMed
    1. Beal, M.F. 2000. Oxidative metabolism. Ann. NY Acad. Sci. 924:164–169. - PubMed
    1. Banhegyi, G., A. Benedetti, M. Csala, and J. Mandl. 2007. Stress on redox. FEBS Lett. 581:3634–3640. - PubMed
    1. Veal, E.A., A.M. Day, and B.A. Morgan. 2007. Hydrogen peroxide sensing and signaling. Mol. Cell. 26:1–14. - PubMed

Publication types

MeSH terms