. 2008 Jul;84(1):280-91.
doi: 10.1189/jlb.0907656. Epub 2008 May 5.

Cellular trafficking of lipoteichoic acid and Toll-like receptor 2 in relation to signaling: role of CD14 and CD36

Affiliations

Cellular trafficking of lipoteichoic acid and Toll-like receptor 2 in relation to signaling: role of CD14 and CD36

Nadra J Nilsen et al. J Leukoc Biol. 2008 Jul.

Abstract

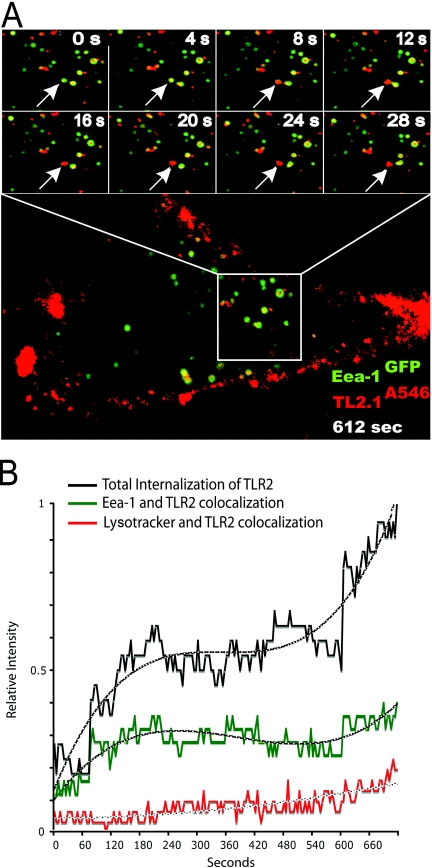
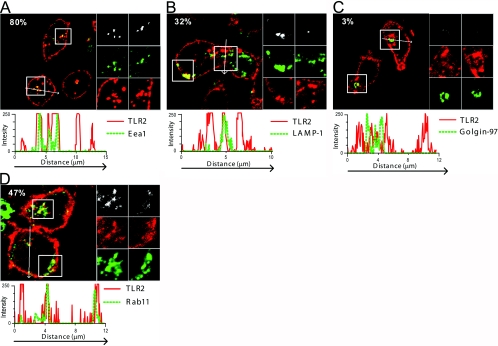
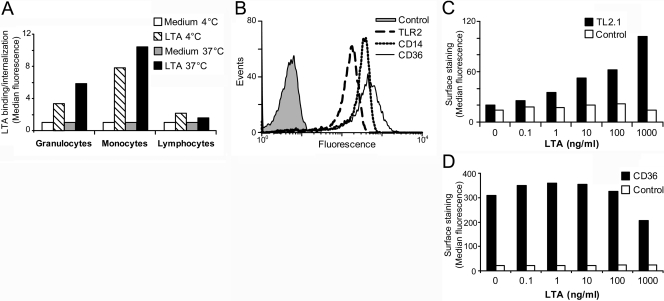
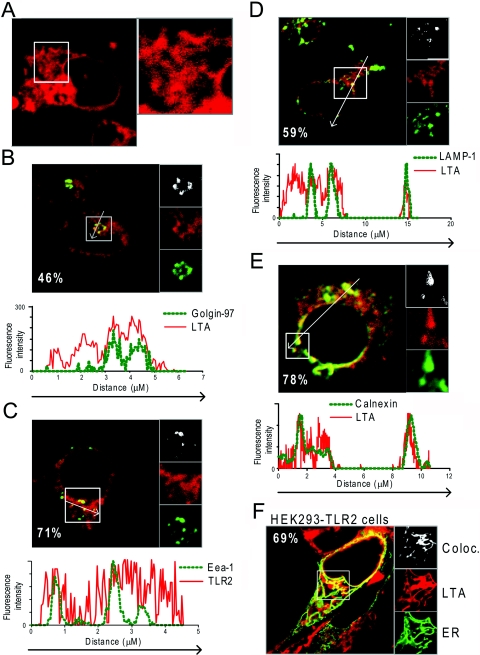
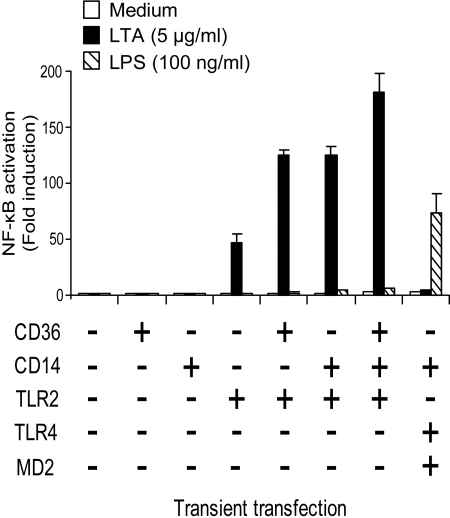
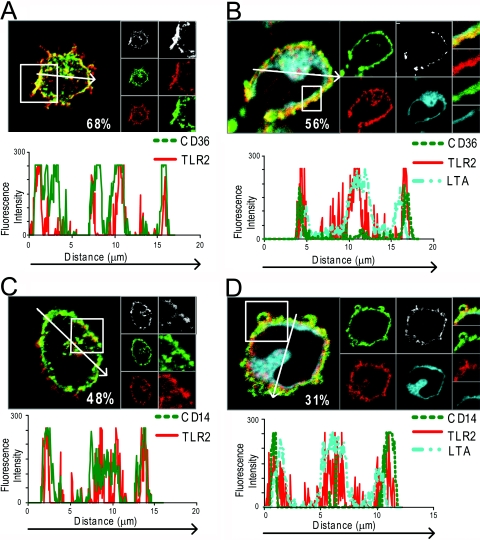
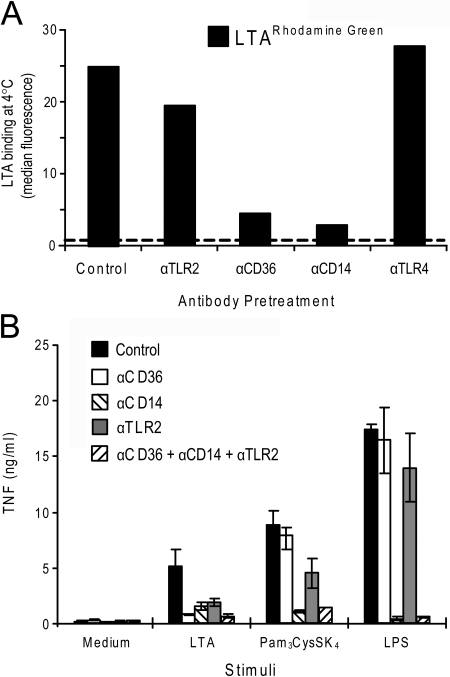
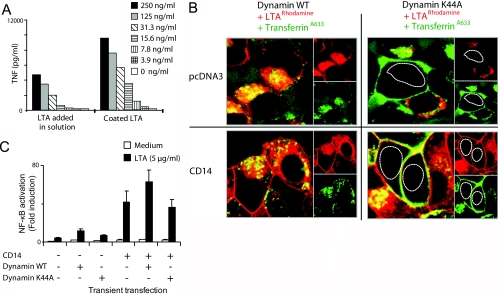
Lipoteichoic acid (LTA) is a central inducer of inflammatory responses caused by Gram-positive bacteria, such as Staphylococcus aureus, via activation of TLR2. Localization of TLR2 in relation to its coreceptors may be important for function. This study explores the signaling, uptake, and trafficking pattern of LTA in relation to expression of TLR2 and its coreceptors CD36 and CD14 in human monocytes. We found TLR2 expressed in early endosomes, late endosomes/lysosomes, and in Rab-11-positive compartments but not in the Golgi apparatus or endoplasmic reticulum (ER). Rapid internalization of fluorescently labeled LTA was observed in human monocytes, colocalizing with markers for early and late endosomes, lysosomes, ER, and Golgi network. Blocking CD14 and CD36 with antibodies inhibited LTA binding and LTA-induced TNF release from monocytes, emphasizing an important role for both molecules as coreceptors for TLR2. Importantly, blocking CD36 did not affect TNF release induced by N-palmitoyl-S-[2,3-bis(palmitoyloxy)-(2R,S)-propyl]-(R)-cysteinyl-seryl-(lysyl)3-lysine or LPS. Expression of CD14 markedly enhanced LTA binding to the plasma membrane and also enhanced NF-kappaB activation. LTA internalization, but not NF-kappaB activation, was inhibited in Dynamin-I K44A dominant-negative transfectants, suggesting that LTA is internalized by receptor-mediated endocytosis but that internalization is not required for signaling. In fact, immobilizing LTA and thereby inhibiting internalization resulted in enhanced TNF release from monocytes. Our results suggest that LTA signaling preferentially occurs at the plasma membrane, is independent of internalization, and is facilitated by CD36 and CD14 as coreceptors for TLR2.


Figures

Figure 1
Figure 1
Surface TLR2 is internalized into endosomes. (A) Confocal images of internalization of TLR2 mAb (red) in MDCK cells expressing Eea-1GFP (green) and TLR2. Images show enlargements of a portion of a representative cell at 4-s interval time-points (two upper panels). Arrows denote an EEA-1GFP (green) endosome containing TLR2 mAb (red) that matures and loses the early endosome tag. The full picture of the cell (lower picture) shows TLR2 mAb internalization after 612 s. Cells were transiently transfected with TLR2 24 h prior to the experiment using Oligofectamine transfection reagent. Cells were kept on ice for 45 min and then incubated with TLR2A546 mAb on ice for 45 min. Image-acquiring was initiated 15 min post-incubation. Image acquisition was performed on an Olympus Fluoview 1000 at 37°C with an Olympus PlanApo 60×/1.42 oil objective. (B) Plot of relative intensity of total TLR2A546 fluorescence (black) and colocalization of TLR2A546 mAb with Eea-1GFP (green) and LysotrackerGreen (red) as a function of time. Results show measurements from five representative cells. Internalization analysis was carried out with ImageJ software. Dotted lines denote polynomial trend lines.
Figure 2
Figure 2
TLR2 is expressed in the plasma membrane, endosomes, lysosomes, and Rab-11-positive compartments but not in the Golgi of monocytes. Confocal images of freshly isolated monocytes stained intracellularly with the TLR2 mAb TL2.1 (red) and antibodies against (A) early endosome marker Eea-1 (green), (B) lysosome marker LAMP-1 (green), (C) trans-Golgi marker Golgin-97 (green), or (D) Rab-11A (green). Areas of colocalization are shown in yellow. Percent values (A–D) denote the area percentage of each marker that colocalizes with TLR2 staining. Panels to the right of each image show enlargements of two sections, denoted by squares in each image. Colocalization maps showing colocalization events between TLR2 and respective marker stainings are shown in the top panels (white). Single tracks of the respective marker (green) and TLR2 (red) are shown in the middle and bottom panels. Profile graphs show fluorescence intensity of each color in a cross-section denoted by an arrow in each image (A–D). Images of cells shown are representative of the cells observed in each dish and are representative of three experiments.
Figure 3
Figure 3
Monocytes efficiently bind and internalize LTA and up-regulate TLR2. (A) Monocytes efficiently bind and internalize LTA. A+ buffy coat from healthy donors was incubated with LTARhodamine Green for 45 min at 4°C or at 37°C, 8% CO2. RBCs were subsequently lysed, and remaining cells were analyzed by flow cytometry to determine LTA binding and uptake. Populations were gated by size and granularity and CD14 high expression (monocytes), CD14 low expression (granulocytes), and CD3 or CD19 expression (lymphocytes). (B) Monocytes were fixed and stained extracellularly with antibody against TLR2, CD14, and CD36 for 45 min on ice and analyzed by flow cytometry. Monocytes were stimulated with LTA (0, 0.1, 1, 10, 100, or 1000 ng/ml) for 16 h and were subsequently stained for surface expression of (C) TLR2 or (D) CD36 prior to determination of median fluorescence by flow cytometry. Results shown are representative of three independent experiments.
Figure 4
Figure 4
LTA is rapidly internalized in tubular structures and targeted to the trans-Golgi network and the ER. (A) Internalization of LTArhodamine (20 μg/ml; red) in live monocytes after 20 min of incubation at 37°C. (B–E) Monocytes incubated with LTArhodamine (red; 20 μg/ml) for 1 h at 37°C, 8% CO2, and subsequently fixed and stained intracellularly with antibodies against (B) Golgin-97 (green), (C) Eea-1 (green), (D) LAMP-1 (green), or (E) ER marker Calnexin and secondary antibody goat anti-mouseA647 (green). (F) Confocal images of live HEK293-TLR2 cells transiently expressing CFP fused to the targeting sequence of calreticulin (ERCFP), which localizes to the ER (green), incubated with LTArhodamine (red; 20 μg/ml) for 1 h at 37°C. (B–F) Percent values denote percent area of each marker that colocalizes with LTArhodamine. Panels to the right of each image (B–F) show enlargements of sections denoted by squares in each image. Colocalization maps showing colocalization events between LTArhodamine and respective marker stainings are shown in the top panels (white). Single tracks of markers are shown in green and LTArhodamine in red. Profile graphs are included, showing fluorescence intensity of each color in a cross-section denoted by an arrow in images (A–E). Images of cells shown are representative of the cells observed in each dish and are representative of three independent experiments.
Figure 5
Figure 5
CD14 and CD36 enhance LTA-induced NF-κB activation mediated by TLR2. (A) HEK293 cells transfected with a NF-κB luciferase reporter plasmid, and TLR2 or TLR2 in combination with CD36 and/or CD14 for 24 h was stimulated with LTA (5 μg/ml) or LPS (100 ng/ml) for 5 h at 37°C, 8% CO2. Cells were subsequently lysed and assayed for NF-κB activation. Results shown are representative of three independent experiments.
Figure 6
Figure 6
CD36 and CD14 are expressed at the plasma membrane, where they colocalize with TLR2. Freshly isolated monocytes incubated with medium (A and C) or LTArhodamine for 1 h (B and D) at 37°C, 5% CO2, and subsequently fixed and stained intracellularly with TLR2 mAb TL2.1A647 (red) and anti-CD36FITC (green; A and B) or TL2.1A647 (red) and anti-CD14A488 (green; C and D). Staining was observed by confocal microscopy. Percent values shown in images denote the percentage area of CD36 or CD14 that colocalizes with TLR2 staining. Panels to the right of each image show enlargements of a section, denoted by a square in each image. Areas of colocalization between CD36 (A) or CD14 (C) and TLR2 stainings are shown in the top panels (white). Single tracks of CD36 (A) or CD14 (C) are shown in green and TLR2 in red in separate panels. (B and D) Separate tracks are shown of CD36 (B) or CD14 (D) in green, TLR2 (red), and LTA (blue). (A–D) Profile graphs show fluorescence intensity of cross-sections denoted by an arrow.
Figure 7
Figure 7
Blocking CD14 or CD36 impairs LTA cell association and subsequent TNF release in monocytes. (A) Monocytes were pretreated with mAb against TLR2, CD36, CD14, or control antibody (10 μg/ml) on ice (0–4°C) for 45 min before addition of LTARhodamine Green (2 μg/ml) for 45 min on ice. Cells were subsequently washed and analyzed by flow cytometry to assess LTA binding. Dotted line denotes background fluorescence of cells incubated with medium only. (B) Monocytes were pretreated with control antibody or mAb against CD36, CD14, or TLR2 or CD36, CD14, and TLR2 in combination for 45 min at room temperature before cells were stimulated with medium, LTA (10 μg/ml), Pam3CysSK4 (50 ng/ml), or LPS (20 ng/ml) for 5 h at 37°C, 5% CO2. Supernatant was harvested and analyzed for TNF by ELISA. Results shown are representative of three independent experiments.
Figure 8
Figure 8
TLR2 signaling in response to LTA occurs at the plasma membrane and is not dependent on Dynamin-I. (A) Immobilizing LTA on a plastic surface enhances TNF release in monocytes, which were stimulated by plating cells in wells coated with LTA or PBS or stimulated by adding medium or LTA in solution. Supernatant was harvested after overnight incubation, and TNF levels were analyzed by ELISA. Results show average TNF release of duplets and are representative of three independent experiments. (B) LTA is internalized by a receptor-mediated mechanism. Confocal images of HEK-TLR2 cells transiently expressing wild-type (WT) Dynamin-I or the mutant Dynamin-I K44A and control pcDNA3 or CD14 incubated with LTArhodamine (red) or transferrinA633 (green) for 30 min at 37°C, 8% CO2, prior to imaging. The nucleuses of cells are outlined in Dynamin-I K44A-expressing cells. (C) LTA-induced NF-κB activation occurs at the plasma membrane, independent of LTA uptake. HEK293-TLR2 cells were transfected with a NF-κB luciferase reporter plasmid and wild-type Dynamin-I or the mutant Dynamin-I K44A in the presence of control pcDNA3 or CD14. Cells were subsequently stimulated with LTA (5 μg/ml) or medium for 6 h, 37°C, 8% CO2, before cells were lysed and assayed for NF-κB activation. Results shown are representative of three experiments.

Similar articles

Cited by

References

    1. Janeway C. A., Jr The immune system evolved to discriminate infectious nonself from noninfectious self. Immunol Today. 1992;13:11–16. - PubMed
    1. Medzhitov R., Janeway C. A., Jr Innate immunity: impact on the adaptive immune response. Curr Opin Immunol. 1997;9:4–9. - PubMed
    1. Marshall C., Kossmann T., Wesselingh S., Spelman D. Methicillin-resistant Staphylococcus aureus and beyond: what’s new in the world of the golden staph? ANZ J Surg. 2004;74:465–469. - PubMed
    1. Raetz C. R., Brozek K. A., Clementz T., Coleman J. D., Galloway S. M., Golenbock D. T., Hampton R. Y. Gram-negative endotoxin: a biologically active lipid. Cold Spring Harb Symp Quant Biol. 1988;53:973–982. - PubMed
    1. Raetz C. R., Ulevitch R. J., Wright S. D., Sibley C. H., Ding A., Nathan C. F. Gram-negative endotoxin: an extraordinary lipid with profound effects on eukaryotic signal transduction. FASEB J. 1991;5:2652–2660. - PubMed

Publication types

MeSH terms