. 2008 May 5;181(3):511-21.
doi: 10.1083/jcb.200710037.

Presynaptic type III neuregulin1-ErbB signaling targets {alpha}7 nicotinic acetylcholine receptors to axons

Affiliations

Presynaptic type III neuregulin1-ErbB signaling targets {alpha}7 nicotinic acetylcholine receptors to axons

Melissa L Hancock et al. J Cell Biol. .

Abstract

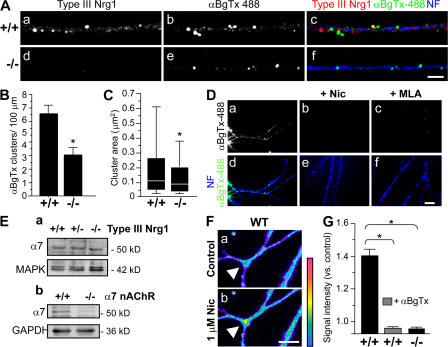
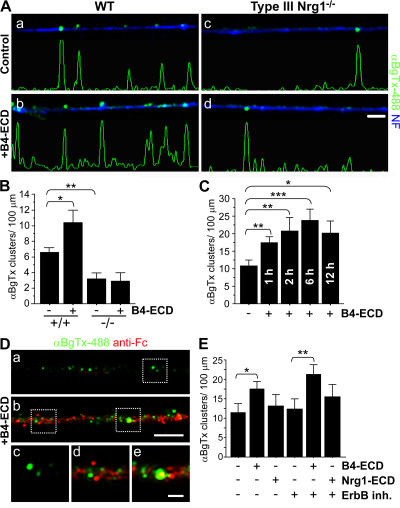
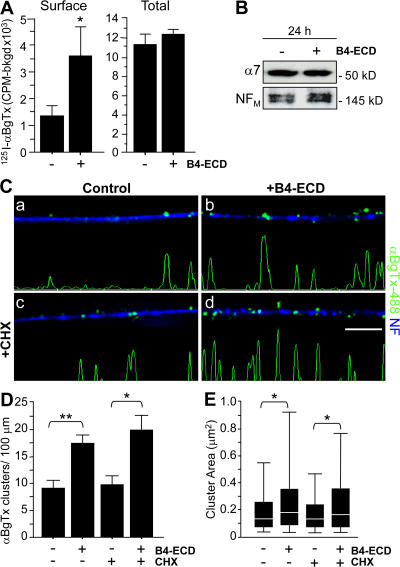
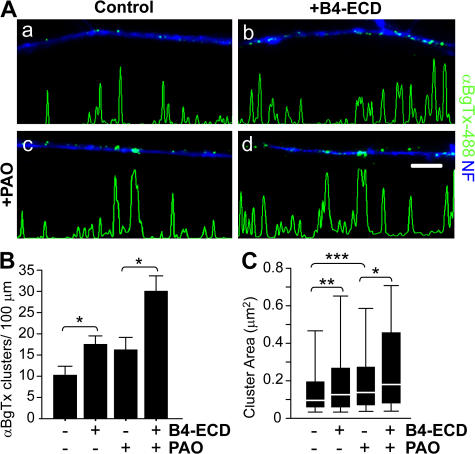
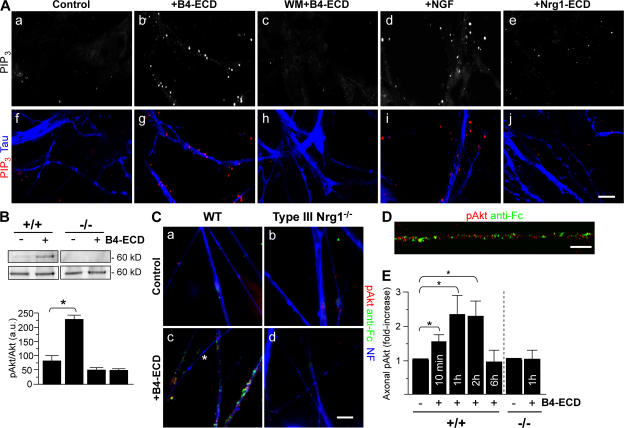
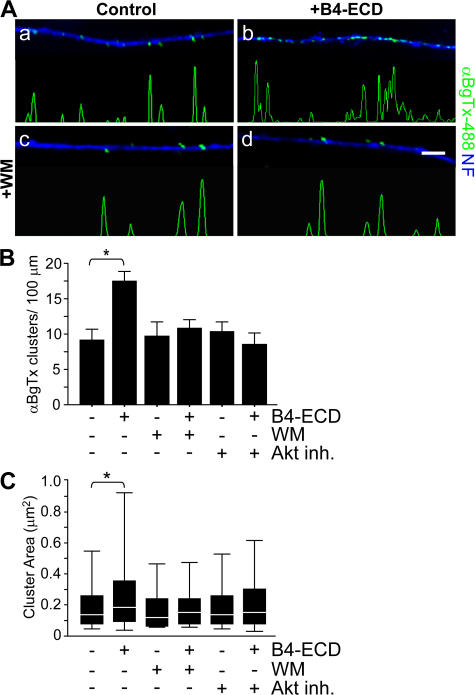
Type III Neuregulin1 (Nrg1) isoforms are membrane-tethered proteins capable of participating in bidirectional juxtacrine signaling. Neuronal nicotinic acetylcholine receptors (nAChRs), which can modulate the release of a rich array of neurotransmitters, are differentially targeted to presynaptic sites. We demonstrate that Type III Nrg1 back signaling regulates the surface expression of alpha7 nAChRs along axons of sensory neurons. Stimulation of Type III Nrg1 back signaling induces an increase in axonal surface alpha7 nAChRs, which results from a redistribution of preexisting intracellular pools of alpha7 rather than from increased protein synthesis. We also demonstrate that Type III Nrg1 back signaling activates a phosphatidylinositol 3-kinase signaling pathway and that activation of this pathway is required for the insertion of preexisting alpha7 nAChRs into the axonal plasma membrane. These findings, in conjunction with prior results establishing that Type III Nrg1 back signaling controls gene transcription, demonstrate that Type III Nrg1 back signaling can regulate both short-and long-term changes in neuronal function.


Figures

Figure 1.
Figure 1.
Decreased surface expression of α7* nAChRs along axons of Type III Nrg1−/− sensory neurons. Sensory ganglia were extirpated from embryonic day (E) 14.5 WT or Type III Nrg1−/− embryos and plated as explants. After 2 d in vitro, neurons were labeled for surface α7* nAChRs with αBgTx-488 (green). Neurons were fixed, permeabilized, and stained for Type III Nrg1 (red) and NF protein (blue). (A) Representative micrographs of αBgTx-488 clusters along NF-positive axons of WT and Type III Nrg1−/− sensory neurons at 2 d in vitro. Type III Nrg1 staining was detected along WT (a) but not Type III Nrg1−/− (d) axons. Fewer surface αBgTx-488 clusters were detected along mutant axons (e) as compared with WT (b). Confocal images were acquired from a 100× oil objective. Bar, 5 μm. (B) Quantification of surface αBgTx-488 clusters per 100 μm of axonal length revealed an ∼50% reduction of clusters along mutant axons. The graph shows means ± SEM. Data were pooled from three independent experiments. Statistical significance determined by ANOVA. *, P < 0.001 (Statview). (C) Quantification of the surface αBgTx-488 cluster area. Loss of Type III Nrg1 expression resulted in an ∼35% reduction of αBgTx-488 cluster area. Data pooled from three independent experiments were analyzed using nonparametric statistics and presented as box plots (see Materials and methods). Statistical significance was determined by the Kolmogorov-Smirnov Test. *, P < 0.0001 (Statview). (D) Pretreatment of sensory neurons with 1 μM of nicotine (Nic; b and e) or 5 μM methyllycaconitine (MLA; c and f) prevents surface αBgTx-488 labeling along axons. Bar, 10 μm. (E) Immunoblot analysis of total α7 subunit protein levels in sensory neurons from E14.5 WT, Type III Nrg1+/−, and Type III Nrg1−/− embryos cultured for 2 d in vitro (a). MAPK1/2 probing in the bottom panel shows equal lysate loading. Immunoblots of total α7 subunit protein levels in brain extracts from WT or α7 nAChR−/− embryos are also shown (b). Glyceraldehyde 3-phosphate dehydrogenase probing in the bottom panel shows equal lysate loading (b). (F) In WT sensory neurons, nicotine application (1 μM for 1 min) resulted in an increased internal concentration of Ca2+ (indicated in pseudo color; described in Materials and methods). The white arrowhead highlights an axonal region affected by nicotine. Bar, 10 μm. (G) Changes in internal concentration of Ca2+ in response to application of nicotine in WT and mutant axons are plotted. Note that 100 nM αBgTx completely eliminated the response to nicotine in WT axons and that sensory axons from Type III Nrg1−/− animals did not respond to nicotine. Data are from two independent experiments. The graph shows means ± SEM. Statistical significance was determined by ANOVA with post-hoc Fisher's PLSD test. *, P < 0.0001 (Statview).
Figure 2.
Figure 2.
Type III Nrg1 back-signaling increases the surface expression of α7* nAChRs. E14.5 WT or Type III Nrg1−/− DRG explants were treated with B2-ECD (control) or B4-ECD for 24 h. Neurons were labeled for surface α7* nAChRs with αBgTx-488 (green), fixed, permeabilized, and labeled for NF protein (blue). (A) Representative micrographs of axons from WT (a and b) or Type III Nrg1−/− (c and d) sensory neurons under control (a and c) versus B4-ECD (b and d) conditions. B4-ECD treatment increased the number of surface αBgTx-488 clusters along NF-positive processes of WT neurons (b). Linescans of fluorescence intensity profile for αBgTx-488 staining along representative axons (see Materials and methods). Bar, 5 μm. (B) Quantification of surface αBgTx-488 clusters along NF-positive axons from WT versus Type III Nrg1−/− DRG explants treated with either B2-ECD (control) or B4-ECD for 24 h. In WT cultures, B4-ECD treatment induced an ∼1.6-fold increase in surface αBgTx clusters along NF-positive axons compared with the control. There was no detectable change in αBgTx clusters along axons of Type III Nrg1−/− neurons. The graph shows means ± SEM. Data were pooled from three independent experiments. Statistical significance was determined by ANOVA with post-hoc Fisher's PLSD test. *, P < 0.03; **, P < 0.001 (Statview). (C) After 2 d in vitro, dissociated sensory neurons from E11 chick embryos were treated with B2-ECD (control) or B4-ECD for 1, 2, 6, or 12 h and labeled as described in A. Axonal surface αBgTx-488 clusters were quantified. Data were pooled from three independent experiments. The graph shows means ± SEM. Statistical significance was determined by ANOVA with post-hoc Fisher's PLSD test. *, P < 0.05; **, P < 0.01; ***, P < 0.001 (Statview). (D) Axonal-bound B4-ECD and αBgTx-488 were detected in puncta along axons treated with B4-ECD (b, d, and e). Sensory neurons from E14.5 WT mouse embryos were cultured for 2 d in vitro and treated with B2-ECD (control) or B4-ECD for 1 h. Before fixation, surface α7* nAChRs and axonal-bound B2-ECD (control) or B4-ECD were labeled with αBgTx-488 (green) and an antibody against the human Fc domain (anti-Fc; red), respectively. c and d and e are magnifications of the areas shown in dotted squares in a and b, respectively. Bar: (a and b) 5 μm; (c–e) 1 μm. (E) Sensory neurons from E11 chick embryos were treated with B2-ECD (control), B4-ECD, or soluble Nrg1β peptide (Nrg1-ECD) for 1 h. In parallel, neurons pretreated with an ErbB tyrosine kinase inhibitor (ErbB inh.) for 45 min were treated with B2-ECD, B4-ECD, or Nrg1-ECD for 1 h. Neurons were labeled as described in A, and surface αBgTx-488 clusters along axons were quantified. Data were pooled from three independent experiments. The graph shows means ± SEM. Statistical significance was determined by ANOVA with post-hoc Fisher's PLSD test. *, P < 0.005; **, P < 0.01 (Statview).
Figure 3.
Figure 3.
Type III Nrg1 back signaling increases the surface expression of α7* nAChRs in the absence of protein synthesis. Dissociated sensory neurons from E11 chick embryos were cultured for 2 d in vitro and treated with either B2-ECD (control) or B4-ECD for 1 or 24 h. (A) Quantification of surface or total pools of α7* nAChR by 125I-αBgTx radiolabeling in sensory neurons treated with either B2-ECD (control) or B4-ECD for 24 h. In response to a 24-h B4-ECD treatment, we detected an ∼2.7-fold increase in surface 125I-αBgTx binding compared with control conditions (B2-ECD [control], 1,339.15 ± 329.77 cpm; and B4-ECD, 3,562.81 ± 1,111.19 cpm). B4-ECD treatment did not induce a change in total 125I-αBgTx binding as compared with the control (B2-ECD [control], 11,159.74 ± 1,059.79 cpm; and B4-ECD, 12,258.85 ± 580.11 cpm). The graph shows means ± SEM. Data were pooled from three independent experiments with greater than or equal to three wells per condition per experiment. Statistical significance was determined by ANOVA. *, P < 0.05 (Statview). (B) Immunoblot analysis of total α7 subunit protein in sensory neurons treated with B2-ECD (control) or B4-ECD treatment for 24 h. In response to B4-ECD treatment, we did not detect a difference in total α7 subunit protein. NFM probing in bottom panel shows equivalent lysate loading. (C) Sensory neurons were treated with B2-ECD (control) or B4-ECD for 1 h. In parallel, neurons pretreated with CHX for 45 min were treated with B2-ECD or B4-ECD for 1 h. Neurons were labeled with αBgTx-488 (green), fixed, permeabilized, and colabeled for NF protein (blue). CHX treatment (c and d) did not affect either the basal number of αBgTx-488 clusters on control neurons (c) or the response to B4-ECD (d). Linescans of fluorescence intensity profiles of αBgTx-488 along representative axons (see Materials and methods) are shown. Bar, 5 μm. (D) Quantification of surface αBgTx-488 clusters along NF-labeled axons. B4-ECD treatment induced an ∼1.9-fold increase in surface αBgTx-488 clusters along axons, and B4-ECD treatment in the presence of CHX induced an ∼2.1-fold increase. Data were pooled from three independent experiments. The graph shows means ± SEM. Statistical significance was determined by ANOVA with post-hoc Fisher's PLSD test. *, P = 0.01; **, P < 0.0001 (Statview). (E) Quantification of surface αBgTx-488 cluster area. B4-ECD treatment in the presence or absence of CHX induced an increase in αBgTx-488 cluster area. Data pooled from three independent experiments were analyzed using nonparametric statistics and presented as box plots (see Materials and methods). Statistical significance was determined by the Kolmogorov-Smirnov Test. *, P ≤ 0.0001 (Statview).
Figure 4.
Figure 4.
Type III Nrg1 back signaling increases α7* nAChRs cluster area in the absence of endocytosis. Dissociated sensory neurons from E11 chick embryos were treated with B2-ECD (control) or B4-ECD for 1 h. In parallel, neurons were treated with PAO for 45 min and treated with B2-ECD or B4-ECD for an additional hour. Neurons were labeled with αBgTx-488 (green), fixed, permeabilized, and colabeled for NF protein (blue). (A) Representative micrographs of αBgTx-488 staining along NF-positive axons. B4-ECD treatment increased surface αBgTx-488 clusters in the presence of PAO (d). Linescans of fluorescence intensity profiles of αBgTx-488 along representative axons (see Materials and methods) are shown. Bar, 5 μm. (B) Quantification of surface αBgTx-488 clusters along NF-labeled axons. B4-ECD treatment in the presence and absence of PAO induced ∼1.7 and 1.9 increases in surface αBgTx-488 clusters along axons, respectively. Data were pooled from two independent experiments. The graph shows means ± SEM. Statistical significance was determined by ANOVA with post-hoc Fisher's PLSD test. *, P < 0.03 (Statview). (C) Quantification of surface αBgTx-488 cluster area. B4-ECD treatment in the presence or absence of PAO induced an increase in αBgTx-488 cluster area. Data pooled from two independent experiments were analyzed using nonparametric statistics and presented as box plots (see Materials and methods). Statistical significance was determined by the Kolmogorov-Smirnov Test. *, P = 0.03; **, P = 0.0001; ***, P < 0.0001 (Statview).
Figure 5.
Figure 5.
Type III Nrg1 back signaling activates the PtdIns 3K signaling pathway. (A) Dissociated sensory neurons from E11 chick embryos were treated for 5 min with B2-ECD (control), B4-ECD, 50 ng/ml NGF, or 10 ng/ml of soluble Nrg1β peptide (Nrg1-ECD). In parallel, neurons were treated with WM for 45 min before B4-ECD stimulation (WM + B4-ECD). Neurons were fixed, permeabilized, and costained for PIP3 (red) and tau protein (blue) to label axons. Both B4-ECD (g) and NGF (i) treatment induced puncta of PIP3 along tau-positive axons. Neither B4-ECD stimulation in the presence of WM (c and h) nor that of Nrg1-ECD (e and j) induced an increase in PIP3. Confocal images were obtained with a 40× oil objective. Bar, 10 μm. (B) Immunoblot analysis of phospho-Akt (Ser 473) in WT or Type III Nrg1−/− sensory neurons treated with either B2-ECD (control) or B4-ECD for 10 min. In WT neurons, B4-ECD treatment induced an approximately threefold increase in phospho-Akt, whereas no response was detected in mutant neurons. Total Akt in the bottom panel shows equal lysate loading. The bar graph represents phospho-Akt normalized to total Akt immunoreactive bands. Data are representative of three independent experiments. The graph shows means ± SEM. Statistical significance was determined by ANOVA with post-hoc Fisher's PLSD test. *, P < 0.002 (Statview). (C and D) E14.5 WT (a and b) or Type III Nrg1−/− (c and d) DRG explants were treated with B2-ECD (control) or B4-ECD for 10 min. Surface-bound B4-ECD or B2-ECD were labeled with an antibody against the human Fc domain (anti-Fc; green) before fixation. Neurons were fixed, permeabilized, and stained for phospho-Akt (red) and NF protein (blue). B4-ECD treatment increased phospho-Akt along Fc-positive axons of WT neurons (b and D) but did not do so along axons of mutant neurons (d). Note the close proximity of anti-FC and phospho-Akt puncta in the high-power micrograph shown in e. The asterisk denotes an axon negative for both anti-Fc and phospho-Akt immunolabeling (c). A 63× oil objective was used (a–d). Confocal imaging was obtained with a 100× oil objective (D). Bar: (a–d)10 μm; (D) 5 μm. (E) Quantification of the average fluorescence intensity (AFI) of phospho-Akt along axons of WT or Type III Nrg1−/− sensory neurons treated with B2-ECD (control) or B4-ECD for 10 min or 1, 2, or 6 h (see Materials and methods). Along WT axons, B4-ECD treatment induced increases in phospho-Akt. Along axons of mutant neurons, we did not detect an increase in phospho-Akt in response to B4-ECD treatment. The graph shows means ± SEM. Data are from three independent experiments. Statistical significance was determined by ANOVA. *, P < 0.02.
Figure 6.
Figure 6.
PtdIns 3K—Akt signaling activated by Type III Nrg1 back signaling is required for increased α7* nAChR surface expression. Dissociated sensory neurons from E11 chick embryos were treated with B2-ECD (control) or B4-ECD for 1 h. In parallel, neurons were pretreated with WM or an Akt inh. for 45 min before treatment with B2-ECD or B4-ECD for an additional hour. Neurons were labeled for surface α7* nAChRs with αBgTx-488 (green), fixed, permeabilized, and costained for NF protein (blue). (A) Representative micrographs of αBgTx-488 staining along NF-positive axons. B4-ECD treatment increased surface αBgTx-488 clusters (b), which did not occur in the presence of WM (d). Linescans of fluorescence intensity profiles of αBgTx-488 along representative axons (see Materials and methods) are shown. Bar, 5 μm. (B) Quantification of surface αBgTx-488 clusters along sensory neuron axons represented in A. B4-ECD treatment induced an ∼1.9-fold increase of surface αBgTx-488 clusters but not in the presence of WM or Akt inh. Data were pooled from three independent experiments. The graph shows means ± SEM. Statistical significance was determined by ANOVA with post-hoc Fisher's PLSD test. *, P < 0.0001 (Statview). (C) Quantification of surface αBgTx-488 cluster area. B4-ECD treatment induced an increase in αBgTx-488 cluster area but not in the presence of WM or Akt inh. Data pooled from three independent experiments were analyzed using nonparametric statistics and presented as box plots (see Materials and methods). Statistical significance determined by the Kolmogorov-Smirnov Test. *, P = 0.0001 (Statview).

Republished in

Similar articles

Cited by

References

    1. Baer, K., T. Burli, K.H. Huh, A. Wiesner, S. Erb-Vogtli, D. Gockeritz-Dujmovic, M. Moransard, A. Nishimune, M.I. Rees, J.M. Henley, et al. 2007. PICK1 interacts with alpha7 neuronal nicotinic acetylcholine receptors and controls their clustering. Mol. Cell. Neurosci. 35:339–355. - PMC - PubMed
    1. Bao, J., D. Wolpowitz, L.W. Role, and D.A. Talmage. 2003. Back signaling by the Nrg-1 intracellular domain. J. Cell Biol. 161:1133–1141. - PMC - PubMed
    1. Bao, J., H. Lin, Y. Ouyang, D. Lei, A. Osman, T.W. Kim, L. Mei, P. Dai, K.K. Ohlemiller, and R.T. Ambron. 2004. Activity-dependent transcription regulation of PSD-95 by neuregulin-1 and Eos. Nat. Neurosci. 7:1250–1258. - PubMed
    1. Berg, D.K., and W.G. Conroy. 2002. Nicotinic alpha 7 receptors: synaptic options and downstream signaling in neurons. J. Neurobiol. 53:512–523. - PubMed
    1. Bermingham-McDonogh, O., Y.T. Xu, M.A. Marchionni, and S.S. Scherer. 1997. Neuregulin expression in PNS neurons: isoforms and regulation by target interactions. Mol. Cell. Neurosci. 10:184–195. - PubMed

Publication types

MeSH terms