. 2008 May 5;181(3):523-36.
doi: 10.1083/jcb.200709029.

The formin mDia2 stabilizes microtubules independently of its actin nucleation activity

Affiliations

The formin mDia2 stabilizes microtubules independently of its actin nucleation activity

Francesca Bartolini et al. J Cell Biol. .

Abstract

A critical microtubule (MT) polarization event in cell migration is the Rho/mDia-dependent stabilization of a subset of MTs oriented toward the direction of migration. Although mDia nucleates actin filaments, it is unclear whether this or a separate activity of mDia underlies MT stabilization. We generated two actin mutants (K853A and I704A) in a constitutively active version of mDia2 containing formin homology domains 1 and 2 (FH1FH2) and found that they still induced stable MTs and bound to the MT TIP proteins EB1 and APC, which have also been implicated in MT stabilization. A dimerization-impaired mutant of mDia2 (W630A) also generated stable MTs in cells. We examined whether FH1FH2mDia2 had direct activity on MTs in vitro and found that it bound directly to MTs, stabilized MTs against cold- and dilution-induced disassembly, and reduced the rates of growth and shortening during MT assembly and disassembly, respectively. These results indicate that mDia2 has a novel MT stabilization activity that is separate from its actin nucleation activity.


Figures

Figure 1.
Figure 1.
K853A and I704A FH1FH2mDia2 point mutants are defective in actin polymerization. (A) K853A and I704A point mutations (top, red stars) were introduced into a constitutively active fragment of mDia2 that includes the FH1 and 2 domains but lacks the GBD and DAD domains. HIS-tagged versions of the mutant (K853A and I704A) and wild-type (WT) proteins were expressed in Escherichia coli, affinity purified, and run on 10% SDS-PAGE followed by Coomassie staining. M, protein markers. (B) Pyrene-labeled monomeric actin was assembled in the presence of the indicated concentrations of wild-type and mutant His-FH1FH2mDia2. The panels below the graph show the rates of actin assembly at 50% polymerization in the presence of different concentrations of wild-type and mutant mDia2. Fluorescence is expressed in arbitrary units (A.U.), and all reactions were performed under identical conditions. (C) Rhodamine-conjugated phalloidin staining of serum-starved NIH3T3 cells microinjected with 8 μM of wild-type, I704A, or K853A His-FH1FH2mDia2 and human IgG as a marker. (D) Quantification of the percentage of cells injected with the indicated constructs of His-FH1FH2mDia2 that exhibit actin fibers (n > 40 cells). (E) TIRF microscopy of EGFP-FH1FH2mDia2 puncta in NIH3T3 cells. Shown is a single frame from movies taken of cells expressing wild-type or actin mutant EGFP-FH1FH2mDia2. Each color line indicates the track of a single EGFP punctum that could be followed for more than three frames. A kymograph of a selected region (white line) from the movie taken with a wild-type–expressing cell is shown below. Bars: (C) 10 μm; (E) 5μm.
Figure 2.
Figure 2.
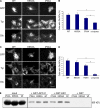
K853A and I704A FH1FH2mDia2 induce stable Glu MTs. (A) Glu and Tyr tubulin immunostaining of serum-starved NIH3T3 cells expressing indicated wild-type (WT) or actin mutant (I704A and K853A) EGFP-FH1FH2mDia2 constructs. (B) Quantification of cells injected with indicated constructs that exhibited stable Glu MTs (Glu). Data are mean ± SD from three independent experiments (n > 50 cells). Asterisks indicate P < 0.001, calculated by χ2 test (one degree of freedom). (C) Glu and Tyr tubulin immunostaining of serum-starved NIH3T3 cells expressing indicated constructs and then treated with 2 μM nocodazole for 30 min. (D) Quantification of cells that exhibited stable Glu MTs after injection of indicated constructs and nocodazole treatment as in C. Data are mean ± SD from three independent experiments (n > 50 cells). Asterisks indicate P < 0.001, calculated by χ2 test (one degree of freedom). (E) Western blot analysis of pulldown experiments using GST-EB1, GST-APC-C, or GST alone incubated with the indicated His-FH1FH2mDia2 proteins. Bound proteins were eluted and resolved by SDS-PAGE and mDia2 proteins were detected by mouse RGS-His antibody. Bars, 10 μm.
Figure 3.
Figure 3.
The dimerization mutant W630A FH1FH2mDia2 induces stable Glu MTs. (A) Elution profiles of the indicated His-FH1FH2mDia2 proteins from analytical Superdex 200 gel filtration. An aliquot of each fraction was analyzed by Western blotting using an anti-His antibody. The arrows indicate elution volumes of standards run under the same conditions. (B) Diagram of W630A His-FH1FH2mDia predicted to be a dimerization mutant (red star indicates the position of the mutation) and comparison of elution profiles of W630A and WT His-FH1FH2mDia2 proteins from analytical Superdex gel filtration analyzed by Western blotting as in A. (C) Pyrene-actin assembly assays using His-tagged wild type (WT) and increasing concentrations of W630A FH1FH2mDia2 (W630A). Fluorescence is expressed in arbitrary units (A.U.) and all reactions were performed under identical conditions. (D) Actin immunostaining of serum-starved NIH3T3 cells expressing microinjected EGFP-tagged W630A FH1FH2mDia2. (E) Glu and Tyr tubulin immunostaining of serum-starved NIH3T3 cells expressing microinjected EGFP-tagged wild-type or W630A FH1FH2mDia2. (F) Quantification of cells that exhibited stable Glu MTs after expression of indicated EGFP-tagged constructs. Data are mean ± SD from three independent experiments (n > 70 cells). Asterisk indicates P < 0.001, calculated by χ2 test (one degree of freedom). (G) Glu tubulin immunostaining of nocodazole-resistant MTs in cells expressing EGFP-tagged W630A FH1FH2mDia2. Bars, 10 μm.
Figure 4.
Figure 4.
FH1FH2mDia2 binds directly to MTs. (A) SDS gel analysis of the cosedimentation of His- (His-mDia2), GST- (GST-mDia2), or untagged (mDia2) FH1FH2mDia2 or GST alone (GST) with taxol-assembled MTs or BSA. Matching input and pellet fractions were resuspended in SDS loading buffer and run on 10% SDS-PAGE followed by Coomassie staining. tub, tubulin. (B) Concentration dependence of FH1FH2mDia2 binding to taxol stabilized MTs (1.5 μM tubulin). Error bars show SEM of three independent experiments. (C) SDS gel analysis of MT cosedimentation assay, as described in A, with His-tagged versions of wild-type (WT) and mutant (K853A, I704A, and W630A) FH1FH2mDia2. (D) Concentration dependence of wild-type and mutant His-FH1FH2mDia2 binding to MTs. Input material (I) and MT (or BSA) pellets material are shown. (E) MT cosedimentation analyses of wild-type and mutant His-FH1FH2mDia2 with intact and sheared MTs. (F) Immunostaining of His-FH1FH2mDia2 on immobilized MTs as described in Materials and methods. Bar, 10 μm.
Figure 5.
Figure 5.
FH1FH2mDia2 stabilizes MTs against cold-induced depolymerization. (A) SDS gel analysis of the resistance of self-assembled MTs to cold-induced depolymerization after incubating with His- (His-mDia2) or GST- (GST-mDia2) tagged FH1FH2mDia2. After centrifugation, equivalent amounts of the pellets and supernatants were resolved by SDS-PAGE and visualized by Coomassie. (B) Immunostaining of MTs that survive cold-induced depolymerization in the presence of His-FH1FH2mDia2 (His-mDia2) or buffer alone. (C) SDS gel analysis of the resistance of self-assembled MTs to cold-induced depolymerization after incubating with wild-type and mutant His-FH1FH2mDia2. Pellets at 4°C and input material are shown. Panels shown are from a single gel. Bar, 10 μm.
Figure 6.
Figure 6.
FH1FH2mDia2 stabilizes MTs against dilution-induced disassembly and the activity maps to the FH2 domain. (A) Immunostaining of MTs that survived dilution induced depolymerization upon incubation with the following indicated proteins (all proteins were His-tagged except BSA): GSK3β, glycogen synthase kinase 3β; WT, wild-type FH1FH2mDia2; I704A, K853A, and W630A, mutant FH1FH2mDia2; FH1FH2ΔC, FH2ΔN, and FH2C, fragments of FH1FH2mDia2 (see B). (B) Diagram of fragments of FH1FH2mDia2 used for MT stability tests in A. (C) Immunostaining of Glu and Tyr MTs and actin in wounded starved NIH3T3 fibroblasts expressing EGFP-FH1FH2ΔC or EGFP-FH2CmDia2. (D) Quantification of cells expressing the indicated constructs that exhibited stable Glu MTs. Data are mean ± SD from three independent experiments (n > 70 cells). Asterisk indicates P < 0.001, calculated by χ2 test (one degree of freedom). Bars, 10 μm.
Figure 7.
Figure 7.
FH1FH2mDia2 stabilizes MTs by decreasing rates of MT disassembly. (A–D) Disassembly assays of MTs elongating from axonemal fragments and induced to disassemble by dilution in the presence or absence of the indicated concentrations of His-FH1FH2mDia2 or buffer alone. The rate of MT shortening was monitored by real-time video DIC microscopy. (A) A series of micrographs taken from a real-time video recording of MTs undergoing shortening. Arrowheads point to MT ends shortening in the presence of 2 μM His-FH1FH2mDia2 (mDia2) or buffer alone. Time is shown in seconds. (B) Histogram of the frequency of final shortening velocities of MT plus and minus ends after dilution into 2 μM His-FH1FH2Dia2 or buffer alone. Arrows indicate means for each condition. Data are normalized percentages of total MTs (to account for differences in sample size; n ≥ 53 ends for each condition). Velocities >90 μm/min are pooled in the last bin. (C) Graphs showing the dependence of shortening velocity of MT plus and minus ends on concentration of His-FH1FH2mDia2 (mDia2). Data are mean ± SE of shortening velocities (n ranges from 3 to 27 for each data point). (D) Plots of life histories of representative MT plus ends induced to disassemble by dilution into buffer alone or into buffer with 2 μM His-FH1FH2mDia2. Bar, 5 μm.

References

    1. Alberts, A.S. 2001. Identification of a carboxyl-terminal diaphanous-related formin homology protein autoregulatory domain. J. Biol. Chem. 276:2824–2830. - PubMed
    1. Cook, T.A., T. Nagasaki, and G.G. Gundersen. 1998. Rho guanosine triphosphatase mediates the selective stabilization of microtubules induced by lysophosphatidic acid. J. Cell Biol. 141:175–185. - PMC - PubMed
    1. Copeland, J.W., and R. Treisman. 2002. The diaphanous-related formin mDia1 controls serum response factor activity through its effects on actin polymerization. Mol. Biol. Cell. 13:4088–4099. - PMC - PubMed
    1. Copeland, J.W., S.J. Copeland, and R. Treisman. 2004. Homo-oligomerization is essential for F-actin assembly by the formin family FH2 domain. J. Biol. Chem. 279:50250–50256. - PubMed
    1. Drechsel, D.N., A.A. Hyman, M.H. Cobb, and M.W. Kirschner. 1992. Modulation of the dynamic instability of tubulin assembly by the microtubule-associated protein tau. Mol. Biol. Cell. 3:1141–1154. - PMC - PubMed

Publication types

MeSH terms