

Neural response to catecholamine depletion in unmedicated subjects with major depressive disorder in remission and healthy subjects
- PMID: 18458204
- PMCID: PMC2676777
- DOI: 10.1001/archpsyc.65.5.521
Neural response to catecholamine depletion in unmedicated subjects with major depressive disorder in remission and healthy subjects
Abstract
Context: The pathophysiologic mechanism of major depressive disorder (MDD) has been consistently associated with altered catecholaminergic function, especially with decreased dopamine neurotransmission, by various sources of largely indirect evidence. An instructive paradigm for more directly investigating the relationship between catecholaminergic function and depression has involved the mood response to experimental catecholamine depletion (CD).
Objectives: To determine whether catecholaminergic dysfunction represents a trait abnormality in MDD and to identify brain circuitry abnormalities involved in the pathophysiologic mechanism of MDD.
Design: Randomized, double-blind, placebo-controlled, crossover, single-site experimental trial.
Setting: Psychiatric outpatient clinic.
Participants: Fifteen unmedicated subjects with MDD in full remission (hereinafter referred to as RMDD subjects) and 13 healthy controls.
Intervention: Induction of CD by oral administration of alpha-methylparatyrosine. Sham depletion used identical capsules containing hydrous lactose.
Main outcome measures: Quantitative positron emission tomography of regional cerebral glucose utilization to study the neural effects of CD and sham depletion. Behavioral assessments included the Montgomery-Asberg Depression Rating Scale and the Snaith-Hamilton Pleasure Scale (anhedonia).
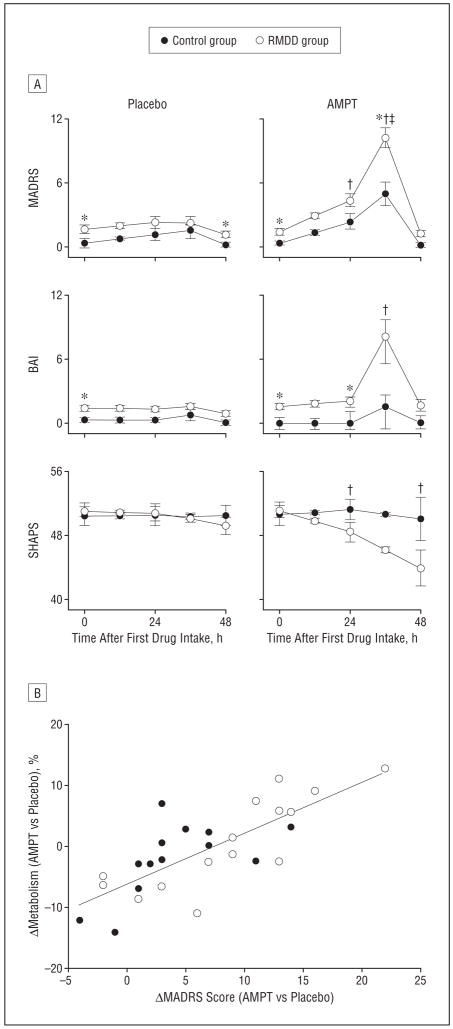
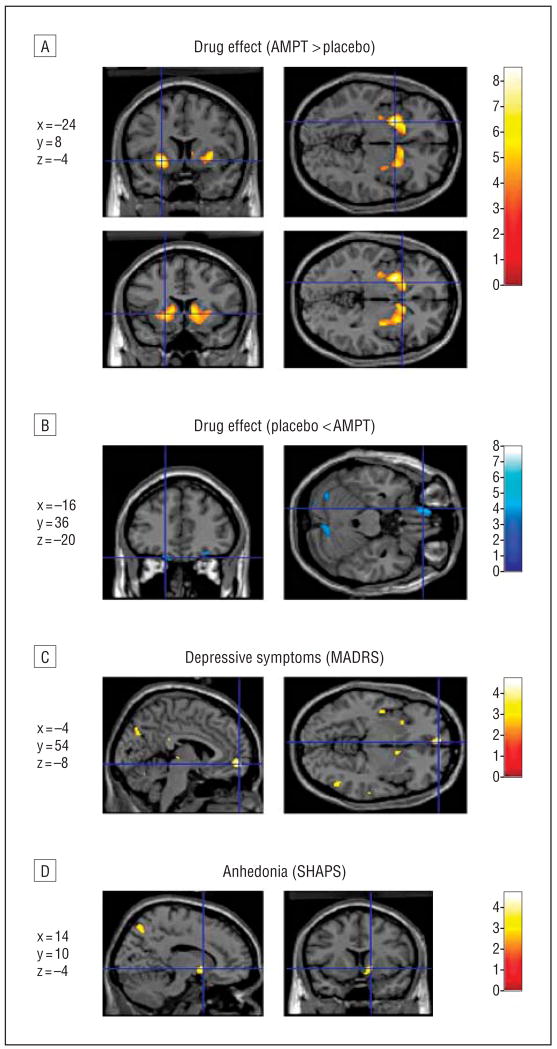
Results: Depressive and anhedonic symptoms increased during CD to a greater extent in RMDD subjects than in controls. In both groups, CD increased metabolism in the anteroventral striatum and decreased metabolism in the orbital gyri. In a limbic-cortical-striatal-pallidal-thalamic network previously implicated in MDD, composed of the ventromedial frontal polar cortex, midcingulate and subgenual anterior cingulate cortex, temporopolar cortex, ventral striatum, and thalamus, metabolism increased in RMDD subjects but decreased or remained unchanged in controls. Metabolic changes induced by CD in the left ventromedial frontal polar cortex correlated positively with depressive symptoms, whereas changes in the anteroventral striatum were correlated with anhedonic symptoms.
Conclusions: This study provides direct evidence for catecholaminergic dysfunction as a trait abnormality in MDD. It demonstrates that depressive and anhedonic symptoms as a result of decreased catecholaminergic neurotransmission are related to elevated activity within the limbic-cortical-striatal-pallidal-thalamic circuitry.
Figures
Similar articles
-
Neural correlates of free T3 alteration after catecholamine depletion in subjects with remitted major depressive disorder and in controls.Psychopharmacology (Berl). 2014 Jan;231(2):409-17. doi: 10.1007/s00213-013-3250-2. Epub 2013 Aug 18. Psychopharmacology (Berl). 2014. PMID: 23954912 Clinical Trial.
-
The effects of catecholamine depletion on the neural response to fearful faces in remitted depression.Int J Neuropsychopharmacol. 2014 Sep;17(9):1419-28. doi: 10.1017/S1461145714000339. Epub 2014 Apr 14. Int J Neuropsychopharmacol. 2014. PMID: 24725805 Clinical Trial.
-
Neural and behavioral responses to tryptophan depletion in unmedicated patients with remitted major depressive disorder and controls.Arch Gen Psychiatry. 2004 Aug;61(8):765-73. doi: 10.1001/archpsyc.61.8.765. Arch Gen Psychiatry. 2004. PMID: 15289275 Clinical Trial.
-
Prefrontal-subcortical and limbic circuit mediation of major depressive disorder.Semin Clin Neuropsychiatry. 2001 Apr;6(2):102-12. doi: 10.1053/scnp.2001.21837. Semin Clin Neuropsychiatry. 2001. PMID: 11296310 Review.
-
The difference in volumetric alternations of the orbitofrontal-limbic-striatal system between major depressive disorder and anxiety disorders: A systematic review and voxel-based meta-analysis.J Affect Disord. 2024 Apr 1;350:65-77. doi: 10.1016/j.jad.2024.01.043. Epub 2024 Jan 8. J Affect Disord. 2024. PMID: 38199394
Cited by
-
Neurocircuitry of mood disorders.Neuropsychopharmacology. 2010 Jan;35(1):192-216. doi: 10.1038/npp.2009.104. Neuropsychopharmacology. 2010. PMID: 19693001 Free PMC article. Review.
-
Molecular basis for the association between depression and circadian rhythm.Tzu Chi Med J. 2019 Apr-Jun;31(2):67-72. doi: 10.4103/tcmj.tcmj_181_18. Tzu Chi Med J. 2019. PMID: 31007484 Free PMC article. Review.
-
Depression, stress, and anhedonia: toward a synthesis and integrated model.Annu Rev Clin Psychol. 2014;10:393-423. doi: 10.1146/annurev-clinpsy-050212-185606. Annu Rev Clin Psychol. 2014. PMID: 24471371 Free PMC article. Review.
-
Impairments of probabilistic response reversal and passive avoidance following catecholamine depletion.Neuropsychopharmacology. 2009 Dec;34(13):2691-8. doi: 10.1038/npp.2009.95. Epub 2009 Aug 12. Neuropsychopharmacology. 2009. PMID: 19675538 Free PMC article. Clinical Trial.
-
Behavioral Response to Catecholamine Depletion in Individuals With Schizophrenia and Healthy Volunteers.Schizophr Bull Open. 2023 Aug 24;4(1):sgad023. doi: 10.1093/schizbullopen/sgad023. eCollection 2023 Jan. Schizophr Bull Open. 2023. PMID: 39145346 Free PMC article.
References
-
- Goodwin FK, Bunney WE., Jr Depressions following reserpine: a reevaluation. Semin Psychiatry. 1971;3(4):435–448. - PubMed
-
- Nutt DJ. The role of dopamine and norepinephrine in depression and antidepressant treatment. J Clin Psychiatry. 2006;67(suppl 6):3–8. - PubMed
-
- Lambert G, Johansson M, Agren H, Friberg P. Reduced brain norepinephrine and dopamine release in treatment-refractory depressive illness: evidence in support of the catecholamine hypothesis of mood disorders. Arch Gen Psychiatry. 2000;57(8):787–793. - PubMed
-
- Dunlop BW, Nemeroff CB. The role of dopamine in the pathophysiology of depression. Arch Gen Psychiatry. 2007;64(3):327–337. - PubMed
-
- Berman RM, Narasimhan M, Miller HL, Anand A, Cappiello A, Oren DA, Heninger GR, Charney DS. Transient depressive relapse induced by catecholamine depletion: potential phenotypic vulnerability marker? Arch Gen Psychiatry. 1999;56(5):395–403. - PubMed
Publication types
MeSH terms
Substances
Grants and funding
LinkOut - more resources
Full Text Sources
Medical
