. 2008 Jul;88(7):694-721.
doi: 10.1038/labinvest.2008.27. Epub 2008 May 5.

Understanding the development of human bladder cancer by using a whole-organ genomic mapping strategy

Affiliations

Understanding the development of human bladder cancer by using a whole-organ genomic mapping strategy

Tadeusz Majewski et al. Lab Invest. 2008 Jul.

Abstract

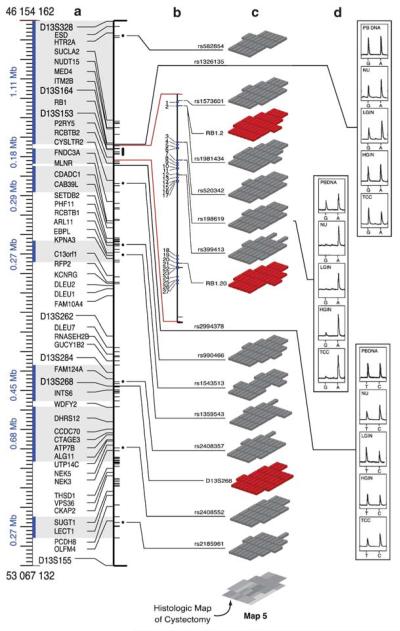
The search for the genomic sequences involved in human cancers can be greatly facilitated by maps of genomic imbalances identifying the involved chromosomal regions, particularly those that participate in the development of occult preneoplastic conditions that progress to clinically aggressive invasive cancer. The integration of such regions with human genome sequence variation may provide valuable clues about their overall structure and gene content. By extension, such knowledge may help us understand the underlying genetic components involved in the initiation and progression of these cancers. We describe the development of a genome-wide map of human bladder cancer that tracks its progression from in situ precursor conditions to invasive disease. Testing for allelic losses using a genome-wide panel of 787 microsatellite markers was performed on multiple DNA samples, extracted from the entire mucosal surface of the bladder and corresponding to normal urothelium, in situ preneoplastic lesions, and invasive carcinoma. Using this approach, we matched the clonal allelic losses in distinct chromosomal regions to specific phases of bladder neoplasia and produced a detailed genetic map of bladder cancer development. These analyses revealed three major waves of genetic changes associated with growth advantages of successive clones and reflecting a stepwise conversion of normal urothelial cells into cancer cells. The genetic changes map to six regions at 3q22-q24, 5q22-q31, 9q21-q22, 10q26, 13q14, and 17p13, which may represent critical hits driving the development of bladder cancer. Finally, we performed high-resolution mapping using single nucleotide polymorphism markers within one region on chromosome 13q14, containing the model tumor suppressor gene RB1, and defined a minimal deleted region associated with clonal expansion of in situ neoplasia. These analyses provided new insights on the involvement of several non-coding sequences mapping to the region and identified novel target genes, termed forerunner (FR) genes, involved in early phases of cancer development.


Figures

Figure 1
Figure 1
Strategy used to construct genomic model of bladder cancer. The primary screening with hypervariable DNA markers was performed on paired samples of non-tumor and invasive tumor DNA. Markers showing LOH were selected for secondary screening on all mucosal samples of the same cystectomy. Markers mapping to autosomes 1–22 were tested on five cystectomy specimens. The pattern of LOH on chromosomes 1–22 was used to construct a genome-wide map of bladder cancer development and to identify six chromosomal regions critical for clonal expansion of in situ neoplasia. Finally, the high-resolution mapping was performed on one of the critical chromosomal regions containing a model tumor suppressor, RB1. These studies defined a minimal deleted region associated with clonal expansion of intraurothelial neoplasia around RB1 and permitted the identification of novel target FR genes providing growth advantage for this expansion.
Figure 2
Figure 2
Organization of the high-resolution mapping studies of 13q14 region. The high-resolution mapping studies of 26.9 Mb in the 13q14 region containing RB1 were performed with SNP markers using WOHGM strategy. The frequency of involvement of a 1.34-Mb minimal deleted region around RB1 was confirmed on 111 samples of bladder tumors by allelotyping of 100 SNPs mapping across 3.16-Mb segment around RB1. The mapping studies were followed by the genomic content analysis of the minimal deleted region, as well as expression, sequencing, methylation, and in vitro functional studies of its positional candidate FR genes. Some of the studies outlined here were previously published and are complemented with the new analyses included in this paper.
Figure 3
Figure 3
Maps of cystectomy specimens used for whole-organ genomic mapping. The distribution of in situ precursor lesions and TCC is shown in each individual cystectomy according to the histologic map code. Foci of carcinoma are outlined by a continuous red line. The histologic grade, pathogenetic subset, and stage for each focus of carcinoma are provided. The histologic map code is as follows: NU, normal urothelium; MD, mild dysplasia; MdD, moderate dysplasia; SD, severe dysplasia; CIS, carcinoma in situ; TCC, transitional cell carcinoma; LGIN, low-grade intraurothelial neoplasia; and HGIN, high-grade intraurothelial neoplasia.
Figure 4
Figure 4
Whole-organ histologic and genetic maps. (a) The histologic map of the entire bladder mucosa showing a distribution of intraurothelial neoplastic lesions and invasive cancer is illustrated. For the purpose of statistical analysis, intraurothelial precursor conditions were classified into two groups: low-grade intraurothelial neoplasia (mild to moderate dysplasia, LGIN) and high-grade intraurothelial neoplasia (severe dysplasia and carcinoma in situ, HGIN). The areas of bladder mucosa that were involved by clonal allelic losses of markers D3S1541 and D12S397 are delineated by interrupted and continuous red lines, respectively. The positions of these markers on the sex-averaged recombination-based map of chromosomes 3 and 12 as well as their band positions are shown on the left. (b) Examples of allelic patterns for the two markers (D12S397 and D3S1541) that were tested on mucosal samples (numbered 1–13) are illustrated. Sample no. 1 shows the allelic pattern of the same marker from peripheral blood lymphocytes (PBDNA) of the same patient. (c) Markers exhibiting clonal losses associated with early and late phases of in situ bladder neoplasia were identified using a computer algorithm that searched for overlapping plaques that matched the areas of bladder mucosa, with NU and LGIN contiguous to areas of HGIN and TCC (gray blocks). The allelic patterns of markers in mucosal samples were compared to their patterns in peripheral blood lymphocytes of the same patient. The chromosomal regions showing allelic losses restricted to later phases of neoplasia were identified by an algorithm that searched for overlapping plaques of losses restricted to HGIN that had progressed to TCC (red blocks). Markers with non-clonal losses involving smaller independent areas of the mucosa with no geographic relationship to in situ neoplasia or invasive cancer were eliminated from the diagram. (Modified and reprinted with permission from Lee S, Jeong J, Majewski T, et al. Proc Natl Acad Sci USA 2007;104:13732–13737.)
Figure 5
Figure 5
Deletion map of chromosome 13 assembled from data generated by whole-organ histologic and genetic mapping. (a) A list of all tested markers and their positions according to the updated Cooperative Human Linkage Center Map and their chromosomal band locations is shown. Markers printed in red showed statistically significant relationship between LOH and the development of urothelial neoplasia tested by binomial maximum likelihood analyses and calculated as logarithm of odds (LOD) scores. Red bars on the left side of the map identify the deleted regions, which are defined by the positions of deleted markers and their nearest flanking markers with retention of heterozygosity and the predicted size of the deleted regions in centiMorgans. A chromosomal region containing RB1 flanked by markers D13S263 and D13S276 spanning 26.9 Mb is oriented with genome sequenced map and the positions of all known and predicted genes mapping to this region are shown (cM, centiMorgans; Mb, megabases; WOHGM, whole-organ histologic and genetic mapping of individual cystectomy specimens consecutively numbered 1 through 8. O – markers with retention of heterozygosity, ● – markers with LOH, and Ø – non-informative marker). (b) Summary of binomial maximum likelihood analysis testing the relationship among LOH in individual chromosome 13 loci and progression of urothelial neoplasia from in situ precursor conditions to invasive TCC. The allelic patterns of markers in mucosal samples were compared to their patterns in peripheral blood lymphocytes of the same patient. Cumulative LOD scores for markers with LOH were calculated at variable θ = (0.01, 0.5, and 0.99) and tested against Tmax. The significance of allelic losses in individual loci was analyzed for normal urothelium (NU); low-grade intraurothelial neoplasia (LGIN); high-grade intraurothelial neoplasia (HGIN), and transitional cell carcinoma (TCC). To simplify the data, only stringency 1 calculations are presented. The patterns of significant LOD scores are as described in Materials and methods. Note that significant patterns of LOD scores typically parallel the high Tmax values (O – LOD score <3; ● – LOD score ≥3). Deletional maps of chromosomes 1–22 are provided in Supplementary Figure 1.
Figure 6
Figure 6
Genome-wide map of bladder cancer progression from intraurothelial precursor conditions to invasive disease. The map was assembled on the basis of whole-organ histologic and genetic mapping of chromosomes 1–22. The outer circle represents chromosomal vectors aligned clockwise from p toq arms with positions of altered markers exhibiting LOH. The innermost concentric circles represent major phases of development and progression of urothelial neoplasia from normal urothelium (NU) through low-grade intraurothelial neoplasia (LGIN), and high-grade intraurothelial neoplasia (HGIN) to transitional cell carcinoma (TCC). The allelic patterns of markers in mucosal samples were compared to their patterns in peripheral blood lymphocytes of the same patient. Solid circles (●) denote statistically significant LOH of the markers defined by the LOD score analysis. Open circles (○) identify LOH without statistically significant association to a given stage of neoplasia. The position of open or solid circles on appropriate concentric circles relates the alterations to a given phase of neoplasia. Only markers with LOH are positioned on the chromosomal vectors. Solid bars on outer brackets represent clusters of markers with significant LOH and denote location of putative chromosomal regions involved in urothelial neoplasia. The distances of markers on chromosomal vectors and the solid bars depicting minimal deleted regions were adjusted to fit the oval and are not drawn to scale.
Figure 7
Figure 7
Genome-wide pattern of LOH identified by WOHGM in a single cystectomy. (a) Three-dimensional display of the LOH distribution patterns in a single cystectomy specimen. The vertical axis represents sex-averaged recombination-based chromosomal maps with positions of hypervariable markers and their chromosomal location. The shaded blocks represent areas of bladder mucosa with LOH as they relate to the development of bladder cancer from in situ neoplasia, represented by a histologic map of the cystectomy shown at the bottom. The allelic patterns of markers in mucosal samples were compared to their patterns in peripheral blood lymphocytes of the same patient. The histologic map code is the same as in Figure 3. (b) Clonal losses associated with expansion of in situ neoplasia. Chromosomal regions exhibiting allelic losses associated with early and late phases of bladder neoplasia were identified as described in Figure 3.
Figure 8
Figure 8
Identification of six critical chromosomal regions involved in the development of bladder cancer. (a) Genome-wide map of putative critical hits associated with clonal expansion of intraurothelial neoplasia assembled on the basis of whole-organ histologic and genetic mapping of chromosomes 1–22 as shown in Figure 4. The outer circle depicts a recombination-based map of chromosomes arranged clockwise from p to q arms with positions of markers indicated. The innermost concentric circles represent genetic maps of the four informative cystectomy specimens. Solid green and red dots denote the positions of markers with allelic losses in individual specimens associated with clonal expansion of in situ neoplastic lesions progressing to TCC. Green dots designate markers showing LOH associated with early clonal expansion that formed large plaques involving TCC, HGIN, and extended to LGIN or NU. Red dots designate markers with clonal LOH restricted to areas of HGIN and TCC. The recombination-based maps of six critical chromosomal regions are expanded and display the positions of their 80 hypervariable DNA markers. The allelic losses of these markers were tested on DNA extracted from voided urine sediments and paired peripheral blood DNA of 63 patients with bladder cancer. In 32 patients, voided urine was collected at the time of initial diagnosis of primary untreated bladder tumor. The remaining 31 patients had a history of bladder tumor removed by transurethral resection and were disease free at the time of urine collection. (b) Frequency of allelic losses identified by individual markers in all 63 DNA samples from voided urine of patients with bladder cancer. (c) Frequency of LOH in six critical chromosomal regions in patients with clinically evident tumor and patients with history of bladder cancer and no evidence of disease at the time of testing. (d) Frequency of LOH in six critical chromosomal regions in low- (grade 1–2) and high (grade 3)-grade TCCs. (e) Frequency of synchronous involvement of one or more critical chromosomal regions identified in voided urine in all 63 patients with bladder cancer. (Modified and reprinted with permission from Lee S, Jeong J, Majewski T, et al. Proc Natl Acad Sci USA 2007;104:13732–13737.)
Figure 9
Figure 9
An example of high-resolution whole-organ mapping by allelotyping of SNPs and the assembly of LOH distribution patterns within RB1-containing region in a single cystectomy specimen. (a) The region containing a cluster of SNPs with allelic loss flanked by markers D13S328 and D13S155 is shown. The bars on the left side indicate the positions of all known and computationally predicted genes. The blue bars on the right side designate the positions of informative polymorphic SNPs. The solid black dots and bars designate SNPs with allelic loss. (b) The genomic map of RB1 is expanded and shows the positions of the five polymorphic SNPs with allelic loss as well as the positions of two polymorphic DNA markers (RB1.2 and RB1.20) with allelic loss. (c) The distribution of clonal allelic losses as they relate to precursor in situ lesions and invasive TCC shown as a histologic map at the bottom is demonstrated. The blocks depict the distribution of clonal allelic losses identified by the hypervariable DNA markers (red blocks) and SNPs (gray blocks). The allelic patterns of SNP markers in mucosal samples were compared to their patterns in peripheral blood lymphocytes of the same patient. The code for the histologic map is shown in Figure 3. The hypervariable DNA markers and SNPs with allelic loss associated with plaque-like clonal expansion involving large areas of bladder mucosa were clustered within and around RB1 and involved approximately 7 Mb. These defined several discontinuous regions of allelic losses associated with early clonal expansion of urothelial cells that ranged in size from approximately 0.27–1.11 Mb and are indicated by the vertical blue bars and gray-shaded areas in (a). The borders and predicted size of these regions were defined by the nearest flanking SNPs or microsatellite markers that retained polymorphism. The blue numbers indicate the predicted size of the deleted regions. (d) An example of clonal loss of a G/A polymorphism in SNP 6 located within intron 12 of RB1 is illustrated. Non-tumor DNA of peripheral blood lymphocytes of the same patient (PBDNA) shows G/A polymorphism of SNP 6, while samples corresponding to NU, LGIN, HGIN, and TCC show clonal loss of G. Retention of polymorphism in two SNPs flanking a segment of allelic loss that involves the RB1 gene is also shown. Overall, these data imply that several discontinuous losses of genetic material, which included RB1 and its flanking regions, occurred in early phases of bladder neoplasia and were associated with in situ expansion of a dominant neoplastic clone. (Modified and reprinted with permission from Lee S, Jeong J, Majewski T, et al. Proc Natl Acad Sci USA 2007;104:13732–13737; (c) and (d) represent new data.)
Figure 10
Figure 10
Integration of LOH and LOP patterns identified in the 13q14 region with RB1 sequencing data and RB protein expression implicating the involvement of FR genes in the intraurothelial expansion of a neoplastic clone. (a) Regions of LOP associated with early clonal expansion identified by WOHGM with SNPs in five cystectomy specimens related to the status of RB1 sequence, RB1(S), and RB protein expression revealed by immunohistochemistry, RB(IH), are illustrated. The results of RB1 sequencing and immunohistochemical studies for RB protein expression are tabulated below the maps of individual bladders. W, wild-type RB1; M, mutant RB1. The mutation in map 2 involved codon 556 of exon 17 consisting of CGA→TGA and resulting in the change of Arg to a stop codon. The presence of immunohistochemically detectable RB protein is designated by +. The absence of RB protein expression is designated by −, and its distribution pattern is shown in the lower panel of (b). The genome sequence map in which the positions of hypervariable markers as well as known genes are designated by the bars on the left side of map. The regions of LOP in five cystectomies (maps 1–5) are depicted by the blue solid bars. The shadowed areas labeled delA and delB designate the regions of LOP flanking RB1 involved in the incipient expansion of a neoplastic clone. The shaded area labeled delRB1 designates the segment of LOP corresponding to the position of RB1 on the sequence genome map. (b) The distribution of clonal LOP involving RB1 and the same regions shown in (a) for map 5 (upper panel) is depicted. The lower panel shows the distribution of the segment with LOP in map 2 depicted in (a). The code for histologic map is shown in Figure 3. (c) Region of clonal LOP associated with growth advantage of in situ neoplasia identified by SNP-based mapping. (d) The immunohistochemical pattern of RB protein expression in representative mucosal samples of map 5 illustrated in (b) as the upper panel and corresponding to NU, LGIN, HGIN, and TCC is shown. The presence of RB protein in all mucosal samples correlated with the sequencing data, which indicated that the remaining wild-type RB1 allele was retained in this case. (e) The immunohistochemical pattern of RB protein expression in representative mucosal samples of map 2 illustrated in the lower panel of (b). Positive nuclear staining for RB1 protein in stromal endothelial cells serves as an internal positive control (arrows). Note the absence of RB protein expression in HGIN and TCC corresponding to an area containing a mutant RB1 allele. Solid black bars within photomicrographs indicate 50 μm. (Reprinted with permission from Lee S, Jeong J, Majewski T, et al. Proc Natl Acad Sci USA 2007;104:13732–13737.)
Figure 11
Figure 11
Map of LOP within 3.16-Mb segment around RB1. (a) Allelic losses were tested on 111 paired samples of bladder tumors and peripheral blood using SNP multiplex technology. Predicted sizes of LOP are depicted as blue bars and a continuous red line shows their frequency. The genomic map above the diagram shows positions of individual genes (solid black bars) and tested SNPs (thin black downward bars). Our previously published data were based on mapping of 84 paired samples of bladder tumor and peripheral blood DNA with 100 SNPs. The selected SNPs were located primarily inside and around the known and predicted genes within the tested region with a mapping gap centromeric to RB1 between the genes HTR2A and SUCLA2. The absence of SNPs spanning a long segment centromeric to RB1 might have resulted in an artificial shift of the deletion frequency curve telomeric to RB1. To address this concern, we tested additional eight SNPs spanning a gap between HTR2A and SUCLA2 and increased the number of tested paired bladder tumor and non-tumor DNA samples to 111. The pattern and frequency of allelic loss generated by this approach were almost identical to our previously data and implies that the most frequent breakpoint is located between RCBTB2 and CDADC1. Overall, the pattern of allelic losses suggests the presence of additional candidate FR genes mapping telomerically to RB1. (b) The allelic losses are related to histologic grade, RB protein expression, RB1 mutation, methylation of ITM2B, and nucleotide substitutions of P2RY5, as summarized in the diagram on the right. Details of RB1 sequencing were published previously. L, low grade (grade 1–2); H, high grade (grade 3); solid blue dots indicate the absence of RB protein expression, mutation of RB1, methylation of ITM2B, and nucleotide substitutions in P2RY5. Red crosses indicate tests not performed. (c) Putative NAHR regions identified by the presence of similar sequences in the same orientation using Human Chained Self Alignment browser. (d) Recombination rates based on HapMap. (e) Recombination rate based on Perlegen. (f) Alu repeat content per 10-kb windows. (g) Human-specific retrotransposons based on UCSC Alignment Nets. (h) Human polymorphic structural variants based on the Center for Applied Genomics Database of Genomic Variants and the UCSC Structural Var track. (i) Placental mammal conservation scores in 500-bp windows. (j) Most conserved elements, 28-way vertebrate Multiz alignment.
Figure 12
Figure 12
Nucleotide substitutions of P2RY5 in sporadic and hereditary cancers. (a) Summary of sequence analysis of P2RY5. The positions of nucleotide substitutions are shown on the full-length mRNA. Details of sequencing are provided in Supplementary Table 2. (b) A G-T polymorphism at codon 307 in the PBDNA resulting in substitution of cysteine for tryptophan was identified by pyrosequencing (same case as shown in (d)). (c) A model of inactive P2RY5 containing seven transmembrane (H1–H7) and one cytoplasmic (H8) helix structures showing the position of polymorphism in codon 307 located within the cytoplasmic domain of the protein (left diagram) that may affect its interaction with the Gαβγ trimeric protein complex (right diagram). (d) Pedigree of a family affected by several common human malignancies that include cancers of the breast, lung, colon, prostate, and uterus as well as acute leukemia. Sequencing of the peripheral blood DNA in individual IV1 identified a mutation of P2RY5.(e) Wild-type sequence of P2RY5 (upper panel). A missense G-C mutation involving codon 111 and resulting in substitution of threonine for serine (S→T) documented by sequencing with subcloning of peripheral blood DNA from individual IV1 shown in (d) (lower panel). (f) Confirmation of a missense G-C mutation involving codon 111 of P2RY5 in individuals IV1, IV6, and IV20 by pyrosequencing (same family as shown in (d)). Note a loss of wild-type P2RY5 allele and retention of a mutant P2RY5 in breast cancer cells from individual IV1. PBDNA, peripheral blood DNA; Br Ca DNA, DNA extracted from breast cancer cells microdissected with laser from paraffin-embedded tissue.
Figure 13
Figure 13
Inactivation of FR genes located within and around RB1 is frequent in many cancer types. Results of quantitative RT-PCR analysis showing relative expression levels of FR genes and RB1 in 62 cell lines derived from major groups of common human malignancies. The expression levels of each gene were compared to their baseline expression in the corresponding normal tissue. The presence of hypermethylation of the ITM2B promoter and mutations of P2RY5 are summarized below the diagram. The relative expression levels of FR genes and RB1 were calculated in comparison to the levels of their normal respective tissues. Note that cell lines derived from colorectal and liver cancers, which in general develop without involvement of RB1 do not show downregulation of the FR genes. Dashed lines designate 90% confidence intervals. Details of sequence analysis of P2RY5 are provided in Supplementary Table 1.
Figure 14
Figure 14
Expression pattern of candidate FR genes near RB1. Results of quantitative RT–PCR showing relative expression of 17 candidate FR genes and RB1 in 12 bladder cancer cell lines compared to cultured normal urothelial cells (NU204).
Figure 15
Figure 15
Dual-track concept of human bladder carcinogenesis. The expansion of preneoplastic clone, which shows minimal phenotypic deviation from the normal urothelium, is the incipient event in bladder carcinogenesis referred to as LGIN. In this phase, the loss of FR genes function provides growth advantage associated with the expansion of proliferating compartment. The proliferating cells expressing normal RB protein are seen in the entire thickness of LGIN. In contrast, normal urothelium contains only scattered proliferating cells expressing RB protein located in its basal layer. The continuous growth of LGIN leads to the development of low-grade superficial papillary TCC. In the non-papillary pathway, a successor clone with microscopic features of HGIN often shows a loss of major tumor suppressors such as RB1 and has a high propensity for progression to an invasive high-grade non-papillary TCC. (a) Normal urothelium (upper panel). Expression of Ki67 in proliferating basal cells of normal urothelium (lower panel, left). Expression of RB protein in peribasal cells of normal urothelium (lower panel, right). (b) Urothelial hyperplasia with mild atypia referred to as LGIN (upper panel). Expression of Ki67 in the entire thickness of LGIN (lower panel, left); expression of RB protein in the entire thickness of LGIN (lower panel, right). (c, d) Low-grade superficial TCC with retention of expression of normal RB protein: insets to (d) show low- and high-power photomicrographs showing expression of normal RB protein in low-grade papillary TCC. (e) Severe intraurothelial dysplasia/carcinoma in situ (HGIN) (upper panel). Loss of RB protein expression in HGIN (lower panel). (f) High-grade invasive non-papillary carcinoma (upper panel). Loss of RB protein expression in high-grade invasive non-papillary TCC. Arrow shows expression of RB protein in endothelial cells adjacent to tumor, which serves as an internal positive control (lower panel). (g) Severe intraurothelial dysplasia/carcinoma in situ developing in bladder mucosa adjacent to a low-grade papillary tumor. It is responsible for switching the pathway and progression of some low-grade papillary tumors to high-grade invasive cancers.
Figure 16
Figure 16
Inactivation of FR and RB1 genes in the development of bladder cancer. (a) The analysis of LOP and inactivation of FR and RB1 genes documented by DNA sequencing, methylation, and immunohistochemical analyses based on data shown in Figure 12. LGPTCC, low-grade (grades 1 and 2) superficial (Ta–T1a) papillary TCC; HGNPTCC, high-grade (grade 3) non-papillary invasive (T1b and higher). (b) Sequential inactivation of P2RY5 and RB1 in the development of bladder cancer from in situ neoplasia. The loss of wild-type P2RY5 copy and the retention of the 1722T variant allele inactivate the P2RY5 gene. Low-power view of invasive bladder cancer and adjacent LGIN and HGIN (upper panel). Microdissected DNA corresponding to LGIN shows loss of wild-type P2RY5 allele and retention of normal RB expression pattern (lower panel, left). Microdissected DNA corresponding to HGIN shows similar loss of wild-type P2RY5 allele and additional loss of RB protein expression (lower panel, center). Similar loss of wild-type P2RY5 allele and RB protein expression is seen in invasive TCC (lower panel, right). Arrows indicate retention of normal RB protein expression in endothelial cells adjacent to tumor. (Reprinted with permission from Lee S, Jeong J, Majewski T, et al. Proc Natl Acad Sci USA 2007;104:13732–13737.) (c) The FR gene hypothesis postulates that their inactivation by allelic loss, methylation, and less frequently by mutations or polymorphism contributes to the initial clonal expansion of in situ neoplasia microscopically consistent with LGIN common to both papillary and non-papillary pathways. The loss of tumor suppressor genes, such as RB1, is secondary and associated with the development of a successor clone showing features of severe dysplasia/carcinoma in situ (HGIN) progressing to invasive TCC.

References

    1. Ayala AG, Ro JY, Amin M, editors. Pathology of Incipient Neoplesia. Oxford University Press; New York: 2001.
    1. Jemal A, Siegel R, Ward E, et al. Cancer statistics. CA Cancer J Clin. 2007;57:43–66. - PubMed
    1. Lynch CF, Cohen MB. Urinary system. Cancer. 1995;75(1 Suppl):316–329. - PubMed
    1. Dinney CP, McConkey DJ, Millikan RE, et al. Focus on bladder cancer. Cancer Cell. 2004;6:111–116. - PubMed
    1. Spiess PE, Czerniak B. Dual-track pathway of bladder carcinogenesis: practical implications. Arch Pathol Lab Med. 2006;130:844–852. - PubMed

Publication types

Substances