. 2008 Feb;2(2):122-134.
doi: 10.1002/prca.200780047.

Evolutionary medicine: A meaningful connection between omics, disease, and treatment

Affiliations

Evolutionary medicine: A meaningful connection between omics, disease, and treatment

Mones Abu-Asab et al. Proteomics Clin Appl. 2008 Feb.

Abstract

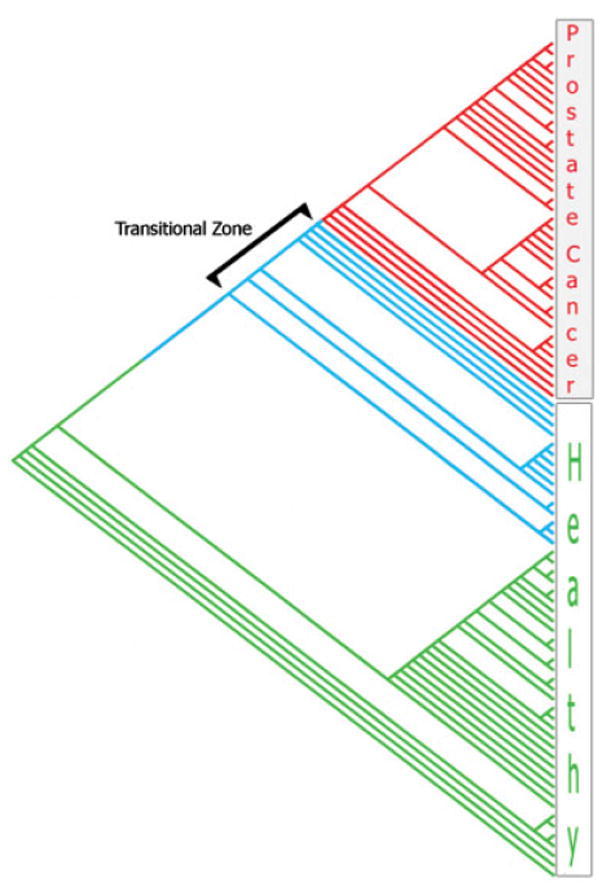
The evolutionary nature of diseases requires that their omics be analyzed by evolution-compatible analytical tools such as parsimony phylogenetics in order to reveal common mutations and pathways' modifications. Since the heterogeneity of the omics data renders some analytical tools such as phenetic clustering and Bayesian likelihood inefficient, a parsimony phylogenetic paradigm seems to connect between the omics and medicine. It offers a seamless, dynamic, predictive, and multidimensional analytical approach that reveals biological classes, and disease ontogenies; its analysis can be translated into practice for early detection, diagnosis, biomarker identification, prognosis, and assessment of treatment. Parsimony phylogenetics identifies classes of specimens, the clades, by their shared derived expressions, the synapomorphies, which are also the potential biomarkers for the classes that they delimit. Synapomorphies are determined through polarity assessment (ancestral vs. derived) of m/z or gene-expression values and parsimony analysis; this process also permits intra and interplatform comparability and produces higher concordance between platforms. Furthermore, major trends in the data are also interpreted from the graphical representation of the data as a tree diagram termed cladogram; it depicts directionality of change, identifies the transitional patterns from healthy to diseased, and can be developed into a predictive tool for early detection.


Conflict of interest statement

The authors have declared a conflict of interest. They will seek US patent rights for their UNIPAL algorithm.

Figures

Figure 1
Figure 1
Flowchart outlining the various stages of an evolutionary phylogenetic analysis of omics data, as well as the interpretation and translation of the analysis results into a clinical setting.
Figure 2
Figure 2
Phylogenetics vs. Phenetics. (A) Phylogenetic cladogram based on maximum parsimony analysis, and (B) phenetic dendrogram based on Pearson’s correlation for the same data set [21]. While the cladogram resolves the relationship between the leiomyoma and leiomyosarcoma specimens by finding 32 uniquely expressed synapomorphies shared by both groups and 20 synapomorphies distinguishing leiomyosarcomas from the leiomyomas, the dendrogram fails to resolve this relationship and clusters the leiomyomas with normal myometrium specimens. The cladogram has directionality for accumulated synapomorphies, and the dendrogram does not. For example, the cladogram indicates that the leiomyosarcoma specimen GSM11779 has the highest number of synapomorphies, and GSM11769 has the lowest. Dataset GDS533 available at http://www.ncbi.nlm.nih.gov/geo/.
Figure 3
Figure 3
Dichotomously asynchronous protein and gene-expression. Two-tailed distribution that occurs in a group of cancerous specimens. (A) Protein intensity at m/z 12 215 of 11 specimens of prostate cancer and 17 normals; six cancerous specimens show upregulation and five downregulations. (B) RNA signal intensity of ten specimens of uterine leiomyosarcoma showing four specimens overexpressing and six underexpressing Akt1.
Figure 4
Figure 4
A most parsimonious cladogram produced by MIX for MS serum proteomic data of 36 prostate cancer patients and 49 healthy men. Each specimen had 15 144 m/z data points; polarity assessment was carried out by UNIPAL. Each line that ends on the right side of the figure represents a specimen. The red part of the cladogram indicates the cancerous specimens as diagnosed before the experiment; the green section indicates the healthy specimens; and the blue shows the presumed healthy specimens that seem to form a transitional zone between the healthy and cancerous clades.
Figure 5
Figure 5
Translating the parsimony phylogenetic analysis of omics into clinical practice. A schematic topology of a typical proteomic cladogram of a cancer analysis. There are two major cancerous clades at the upper section of the cladogram; transitional clades in the middle section; and the basal healthy clades. Adding an unknown specimen to an analysis will have three possible scenarios: scenario A indicates the likely location of a healthy specimen within the healthy clades; scenario B places a specimen from a susceptible individual with the transitional clades between the healthy and cancerous clades; and scenario C would locate a cancerous specimen within one of the two major cancer clades. A post-treatment analysis may change the location from the cancerous to transitional or healthy clades depending on the treatment’s efficacy.

References

    1. Nesse RM, Stearns SC, Omenn GS. Medicine needs evolution. Science. 2006;311:1071. - PubMed
    1. Abu-Asab M, Chaouchi M, Amri H. Phyloproteomics: what phylogenetic analysis reveals about serum proteomics. J Proteome Res. 2006;5:2236–2240. - PMC - PubMed
    1. Shackney SE, Silverman JF. Molecular evolutionary patterns in breast cancer. Adv Anat Pathol. 2003;10:278–290. - PubMed
    1. Azzone GF. The nature of diseases: evolutionary, thermodynamic and historical aspects. Hist Philos Life Sci. 1996;18:83–106. - PubMed
    1. Sarnat HB, Netsky MG. Hypothesis: Phylogenetic diseases of the nervous system. Can J Neurol Sci. 1984;11:29–33. - PubMed

LinkOut - more resources