. 2008 May;41(1):17-28.
doi: 10.1007/s10858-008-9237-3. Epub 2008 May 6.

Protein backbone motions viewed by intraresidue and sequential HN-Halpha residual dipolar couplings

Affiliations

Protein backbone motions viewed by intraresidue and sequential HN-Halpha residual dipolar couplings

Beat Vögeli et al. J Biomol NMR. 2008 May.

Abstract

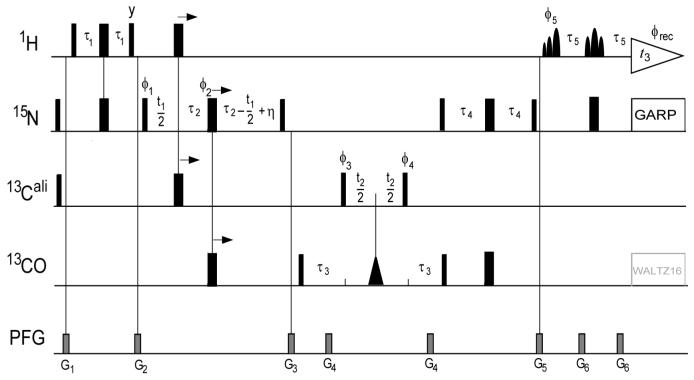
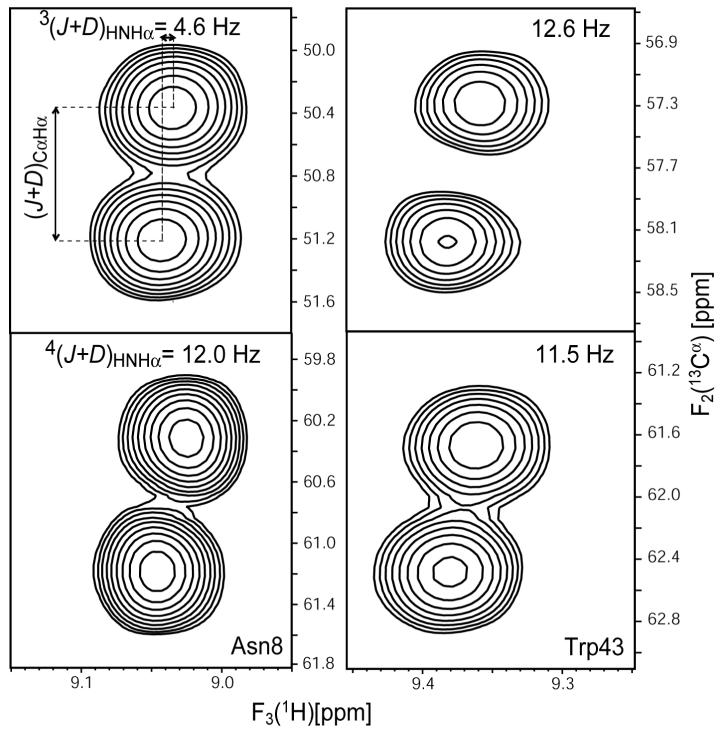
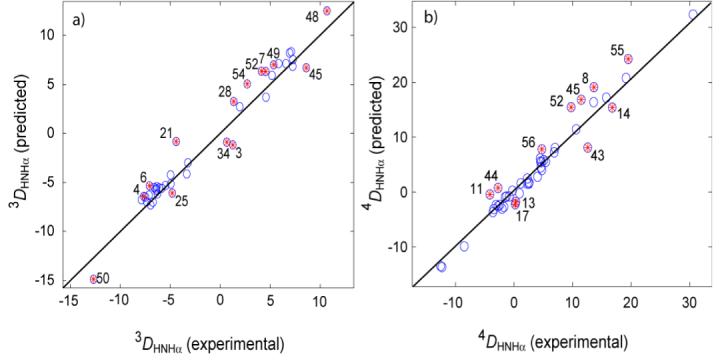
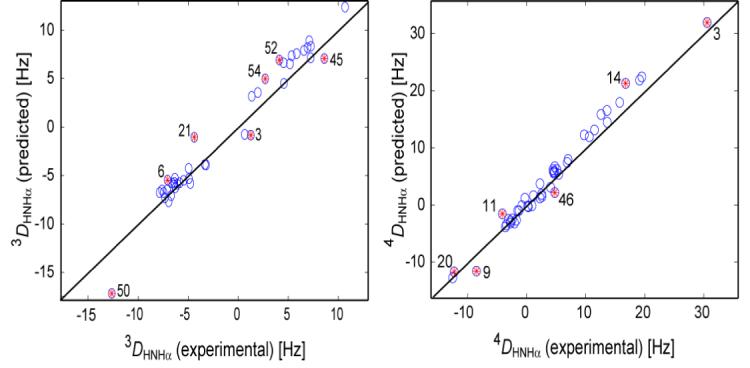
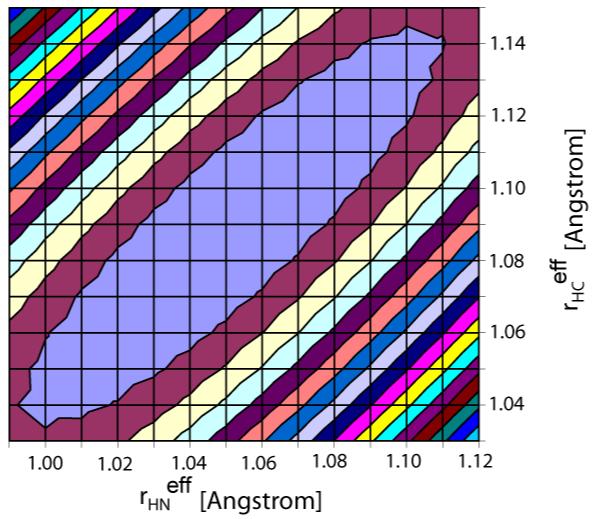
Triple resonance E.COSY-based techniques were used to measure intra-residue and sequential H(N)-H(alpha) residual dipolar couplings (RDCs) for the third IgG-binding domain of protein G (GB3), aligned in Pf1 medium. Measurements closely correlate with values predicted on the basis of an NMR structure, previously determined on the basis of a large number of one-bond backbone RDCs measured in five alignment media. However, in particular the sequential H(N)-H(alpha) RDCs are smaller than predicted for a static structure, suggesting a degree of motion for these internuclear vectors that exceeds that of the backbone amide N-H vectors. Of all experimentally determined GB3 structures available, the best correlation between experimental (1)H-(1)H couplings is observed for a GB3 ensemble, previously derived to generate a realistic picture of the conformational space sampled by GB3 (Clore and Schwieters, J Mol Biol 355:879-886, 2006). However, for both NMR and X-ray-derived structures the (1)H-(1)H couplings are found to be systematically smaller than expected on the basis of alignment tensors derived from (15)N-(1)H amide RDCs, assuming librationally corrected N-H bond lengths of 1.041 A.


Figures

Figure 1
Figure 1
Pulse sequence of the 3D HN(CO)CA[HA]-E.COSY experiment for measurement of sequential DHαHN couplings. The radio-frequency pulses on 1H, 15N, 13Cα and 13C’ are applied at 4.7, 120, 56 and 174 ppm, respectively. Narrow and wide bars indicate non-selective 90° and 180° pulses. The triangular shape represents a 13C’-selective 180°-Gaussian pulse of duration p1 = 150 μs; the shaped 1HN-selective EBURP and ReBURP pulses (Geen and Freeman, 1991) have durations p2 = 1.0 ms and p3 = 1.5 ms and are applied at 10.2 ppm and 9.9 ppm, respectively, on a 600 MHz instrument. The duration of the shaped pulses needs to be adjusted inversely with the strength of the static magnetic field. 15N-decoupling is achieved with WALTZ16 (Shaka et al., 1983) at a RF field strength γB1 = 1.1 kHz, and optional 13C’-decoupling is also achieved with WALTZ16 (γB1 = 600 Hz). Unless indicated otherwise, all radio-frequency pulses are applied with phase x. The phase cycle is: ϕ1 = x; ϕ2 = {x, y,-x,-y}; ϕ3 = x; ϕ4 = {x, x,-x,-x}; ϕ5 = {x, x, x, x,-x,-x,-x,-x}; ϕrec = {x,-x,-x, x,-x, x, x,-x}. The delays have the following values: τ1 = 1/(4JHN) = 2.6 ms, τ2 = 1/(4JNC’) = 13.5 ms, τ3 = 6.5 ms = 0.7 × 1/(2JCαC’), τ4 = 11 ms < 1/(4JNC) and η is the length of the 13Cα 180° pulse. Pulsed field gradients (PFG) are applied along the z-axis with duration/strength of: G1, 0.5 ms / 12 G/cm; G2, 2 ms / 18 G/cm; G3, 1.5 ms / -10 G/cm; G4, 0.7 ms / -18 G/cm; G5, 1 ms / 15 G/cm; G6, 0.2 ms / 18 G/cm. Quadrature detection in the 15N (t1) and 13C(t2) dimension is achieved by the States-TPPI method, applied to the phases ϕ1 and ϕ3, respectively.
Figure 2
Figure 2
Small regions of (F2,F3) cross sections through the HNCA[HA] (top, intraresidue) and HN(CO)CA[HA] (bottom, sequential) E.COSY spectra of GB3 taken at the 15N frequencies of Asn8 (left) and Trp43 (right). Multiplets exhibit the 1JCαHα + 1DCαHα splitting in the 13C dimension, and the JHαHN + DHNHα displacement in the HN dimension.
Figure 3
Figure 3
Correction in Hz to be applied to the (D + J) value as measured from the E.COSY spectra, as a function of (D + J) and R1. Opposite sign corrections of the same magnitude are required for interactions where (D + J) < 0. Corrections were derived using peak picking on multiplets simulated using eq 9, assuming HN Lorentzian (left) or Gaussian (right) line shapes with line width at half height of 35 Hz, and Hα spin flips occurring between the end of the Cα evolution period and the start of direct detection (28.8 ms).
Figure 4
Figure 4
Correlation plots showing predicted versus experimental RDCs for (a) 3DHNHα and (b)4DHαHN for 2OED. The effective alignment tensor is obtained from the 1DHN RDCs and used for the prediction of all RDCs (rNHeff is 1.041 Ǻ). Table 1 presents statistics regarding the observed correlations. Highly flexible residues 12, 40 and 41 are excluded. Symbols embossed with red asterisks correspond to residues that fall more than one standard deviation from a linear regression best fit. Residue labeling corresponds to the residue on which HN resides.
Figure 5
Figure 5
Correlation plots showing predicted versus experimental RDCs for (a) 3DHNHα and (b) 4DHαHN, for a 160 conformer ensemble (Clore and Schwieters, 2006). The effective alignment tensor is obtained from the 1DHN RDCs and used for the prediction of all other RDCs (rNHeff is 1.041 Ǻ). Table 1 presents statistics regarding the observed correlations. Symbols embossed with red asterisks correspond to RDCs that differ by more than 1.5 standard deviations from a linear regression best fit. Residue labeling for 4DHαHN corresponds to the residue on which HN resides.
Figure 6
Figure 6
RMSD between experimental and predicted sequential DHNHα couplings in GB3 versus rHN and rCαHα bond lengths for the 160-conformer ensemble. Equidistant lines are drawn in steps of 0.03 Hz above the minimal rmsd of 1.16 Hz (at rHN = 1.05 Ǻ and rCαHα = 1.09 Ǻ). The blue ellipse covers bond length pairs with an rmsd which is not statistically significantly larger than the minimal rmsd (<1.19 Hz).

Similar articles

Cited by

References

    1. Bax A, Kontaxis G, Tjandra N. Dipolar couplings in macromolecular structure determination. Meth Enzymol. 2001;339:127–174. - PubMed
    1. Biamonti C, Rios CB, Lyons BA, Montelione GT. Multidimensional NMR experiments and analysis techniques for determining homo- and heteronuclear scalar coupling constants in proteins and nucleic acids. Advances in Biophysical Chemistry. 1994;4:51–120.
    1. Bolon PJ, Prestegard JH. COSY cross-peaks from H-1-H-1 dipolar couplings in NMR spectra of field oriented oligosaccharides. J Am Chem Soc. 1998;120:9366–9367.
    1. Bouvignies G, Bernado P, Meier S, Cho K, Grzesiek S, Bruschweiler R, Blackledge M. Identification of slow correlated motions in proteins using residual dipolar and hydrogen-bond scalar couplings. Proc Natl Acad Sci U S A. 2005;102:13885–13890. - PMC - PubMed
    1. Cai ML, Wang H, Olejniczak ET, Meadows RP, Gunasekera AH, Xu N, Fesik SW. Accurate measurement of H-N-H-alpha residual dipolar couplings in proteins. J Magn Reson. 1999;139:451–453. - PubMed

Publication types