. 2008 Oct;35(10):1899-911.
doi: 10.1007/s00259-008-0796-z. Epub 2008 May 6.

Non-invasive estimation of hepatic blood perfusion from H2 15O PET images using tissue-derived arterial and portal input functions

Affiliations

Non-invasive estimation of hepatic blood perfusion from H2 15O PET images using tissue-derived arterial and portal input functions

N Kudomi et al. Eur J Nucl Med Mol Imaging. 2008 Oct.

Abstract

Purpose: The liver is perfused through the portal vein and the hepatic artery. When its perfusion is assessed using positron emission tomography (PET) and (15)O-labeled water (H(2) (15)O), calculations require a dual blood input function (DIF), i.e., arterial and portal blood activity curves. The former can be generally obtained invasively, but blood withdrawal from the portal vein is not feasible in humans. The aim of the present study was to develop a new technique to estimate quantitative liver perfusion from H(2) (15)O PET images with a completely non-invasive approach.

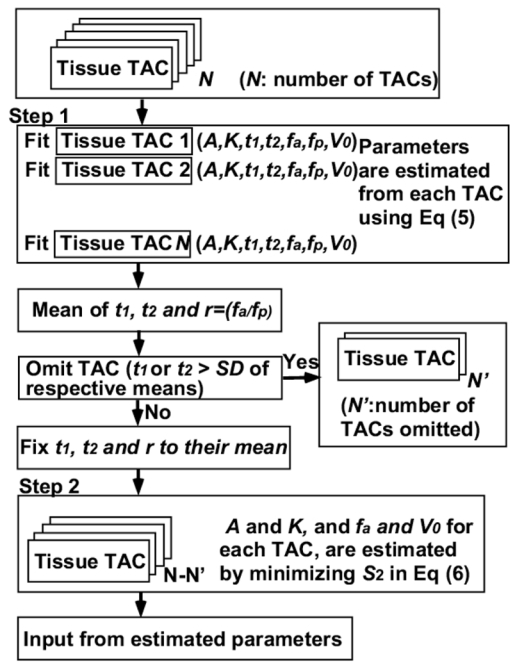
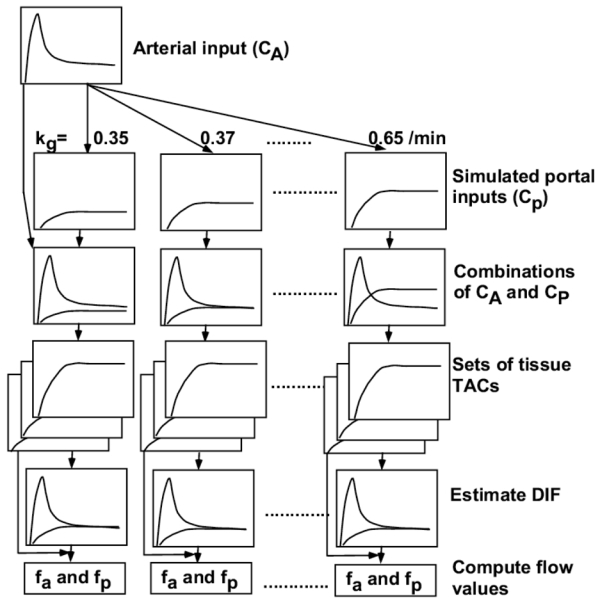
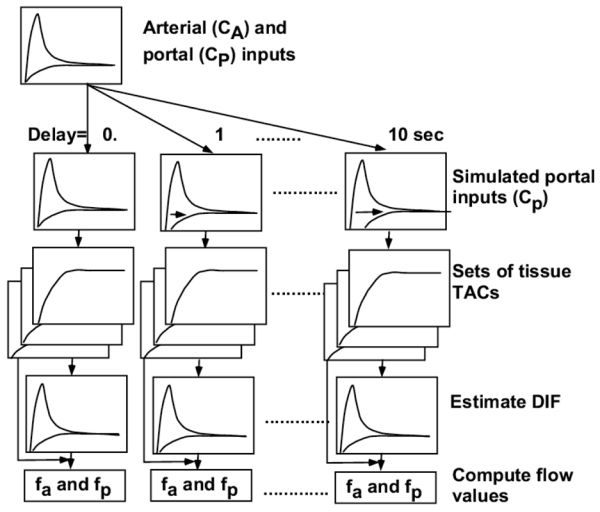
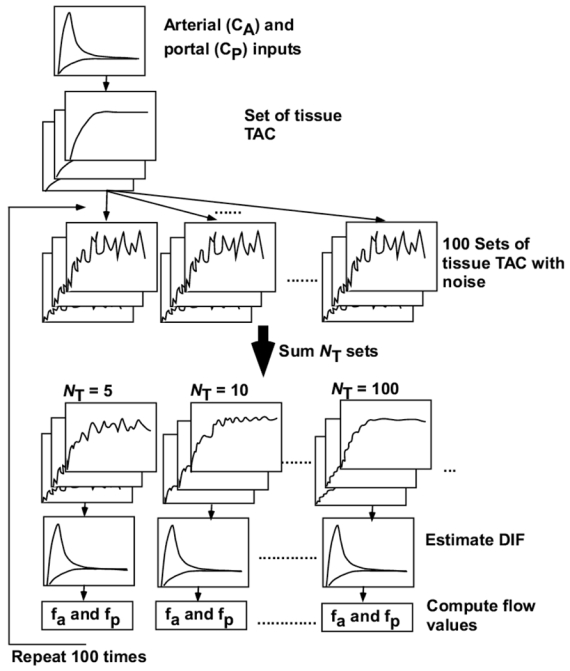
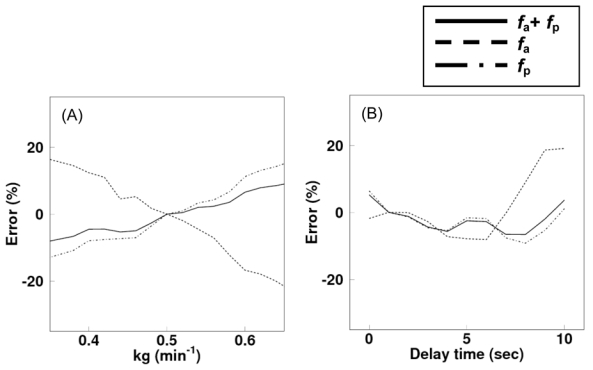
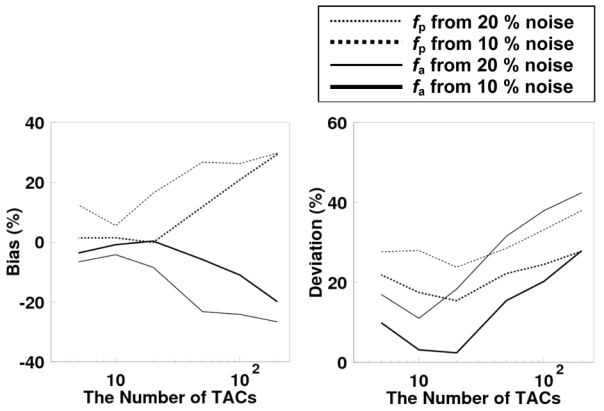
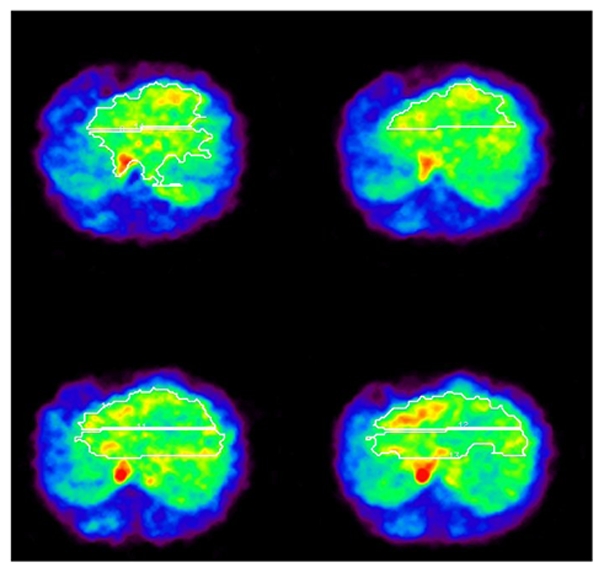
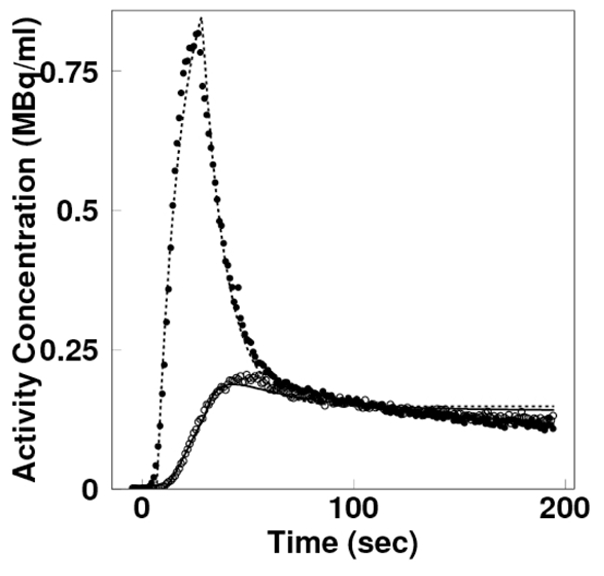
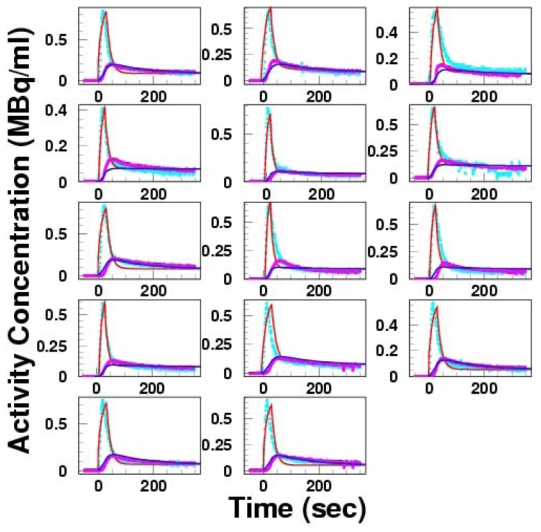
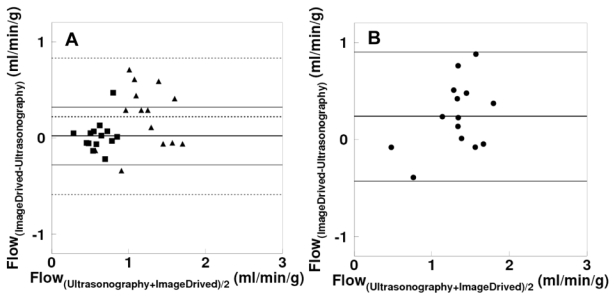
Methods: We studied normal pigs (n=14) in which arterial and portal blood tracer concentrations and Doppler ultrasonography flow rates were determined invasively to serve as reference measurements. Our technique consisted of using model DIF to create tissue model function and the latter method to simultaneously fit multiple liver time-activity curves from images. The parameters obtained reproduced the DIF. Simulation studies were performed to examine the magnitude of potential biases in the flow values and to optimize the extraction of multiple tissue curves from the image.

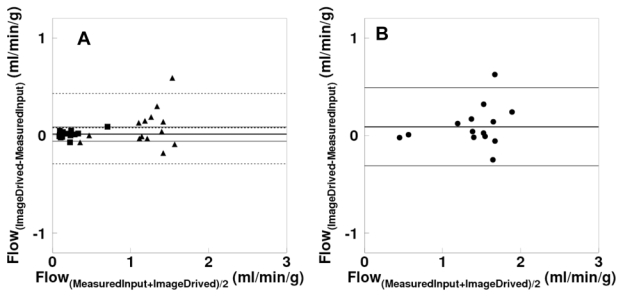
Results: The simulation showed that the error associated with assumed parameters was <10%, and the optimal number of tissue curves was between 10 and 20. The estimated DIFs were well reproduced against the measured ones. In addition, the calculated liver perfusion values were not different between the methods and showed a tight correlation (r=0.90).

Conclusion: In conclusion, our results demonstrate that DIF can be estimated directly from tissue curves obtained through H(2) (15)O PET imaging. This suggests the possibility to enable completely non-invasive technique to assess liver perfusion in patho-physiological studies.


Figures

Fig 1
Fig 1
A schematic diagram of the procedure to estimate the input functions using multiple tissue TACs. (Step 1) the model function (Eq (4)) was individually fitted to N tissue time activity curves (TAC). Then, means and standard deviations of t1, t2, and ra were calculated, and the tissue TACs with values of t1 or t2 > one standard deviation of respective means were excluded (indicated as N′ TACs) to avoid the potential influence of TACs outside the liver. In the second step, assuming that all parts of the liver share the same input functions, values of t1, t2, and ra were fixed to their means and the other two parameters (A and Ke(1+α)) were estimated by minimizing the Eq (6) by the grid search method. Finally, the image based input function was obtained by substituting the estimated parameters into Eq (1).
Fig 2
Fig 2
Schematic diagram of the procedure to analyze error sensitivity in hepatic arterial (fa) and portal flow (fp) values against assumed kg (A) and time delay (B). Portal input curves were created by changing the value of kg from 0.35 to 0.65/min in (A) and by shifting the time from 0 to 10 sec in (B), respectively, and combinations of the arterial (CA) and simulated portal (CP) curves were used as the simulated dual input functions (DIF). Sets of tissue time acticity curves (TAC) were generated from these simulated DIFs, by assuming ten values of fa from 13 to 17 ml/min/100g. In turn, each set of tissue TACs was used to back-estimate DIF fixing kg as 0.5/min and time delay as 0.0 sec. Finally, fa and fp were calculated from estimated DIFs for each kg and delay time. TAC: time activity curve, DIF: dual input function.
Fig 2
Fig 2
Schematic diagram of the procedure to analyze error sensitivity in hepatic arterial (fa) and portal flow (fp) values against assumed kg (A) and time delay (B). Portal input curves were created by changing the value of kg from 0.35 to 0.65/min in (A) and by shifting the time from 0 to 10 sec in (B), respectively, and combinations of the arterial (CA) and simulated portal (CP) curves were used as the simulated dual input functions (DIF). Sets of tissue time acticity curves (TAC) were generated from these simulated DIFs, by assuming ten values of fa from 13 to 17 ml/min/100g. In turn, each set of tissue TACs was used to back-estimate DIF fixing kg as 0.5/min and time delay as 0.0 sec. Finally, fa and fp were calculated from estimated DIFs for each kg and delay time. TAC: time activity curve, DIF: dual input function.
Fig 3
Fig 3
Schematic diagram of the procedure to analyze statistical accuracy of hepatic arterial (fa) and portal flow (fp) values against noise on tissue curves., First, tissue time activity curves (TAC) with noise were generated by imposing Gaussian noise on the set of ten hepatic tissue TACs. This procedure was repeated 100 times and 100 sets of noisy tissue TACs were obtained. Next, the NT (= 5, 10, 20, 50, 100 and 200) sets of tissue TACs with the same flow value were summed. For each NT, dual input function (DIF) was estimated. Then, arterial (fa) and portal blood flow (fb) values were computed using estimated DIF and tissue TACs. This procedure was repeated 100 times.
Fig 4
Fig 4
Error in values of arterial (fa), portal vein (fp) and total (fa+fp), blood flow propagated from error in kg (A) and delay time (B).
Fig 5
Fig 5
Bias (left) and deviation (right) in the arterial and portal vein blood flow values as a function of the number of time activity curves applied to the estimation of the input function.
Fig 6
Fig 6
View of liver H215O-PET images in four slices and sub-regions (solid line). The small area with high activity levels on the mid-right and -left side of the image corresponds to the vena cava and aorta, respectively.
Fig 7
Fig 7
Time-activity curves representing the arterial (broken line) and portal (solid line) model input functions (Eqs (1) and (2)), in comparison with the measured arterial (black circles) and portal (open circles) input functions.
Fig 8
Fig 8
Estimated arterial (red line) and portal vein (blue line) input functions from PET images, and their comparison with measured arterial (plot in light blue) and portal input (plot in pink) functions.
Fig 9
Fig 9
(A) Bland-Altman plot for arterial (square), portal (triangle) and (B) total hepatic blood flow differences between measured and image derived input functions.
Fig 10
Fig 10
(A) Bland-Altman plot for arterial (square), portal (triangle) and (B) total hepatic blood flow differences between ultrasonography and kinetic modeling using image derived input functions.

References

    1. Alenius S, Ruotsalainen U. Bayesian image reconstruction for emission tomography based on median root prior. Eur J Nucl Med . 1997;24:258–65. - PubMed
    1. Becker GA, Muller-Schauenburg W, Spilker ME, Machulla HJ, Piert M. A priori identifiability of a one-compartment model with two input functions for liver blood flow measurements. Phys Med Biol . 2005;50:1393–404. - PubMed
    1. Bland JM, Altman DG. Statistical methods for assessing agreement between two methods of clinical measurement. Lancet . 1986;1:307–10. - PubMed
    1. Blomley MJ, Coulden R, Dawson P, et al. Liver perfusion studied with ultrafast CT. J Comput Assist Tomogr. 1995;19:424–433. - PubMed
    1. Carson RE. Parameter estimation in positron emission tomography. In: Phelps ME, Mazziotta JC, Schelbert HR, editors. Positron Emission Tomography and Autoradiography: Principles and Applications for the Brain and Heart. New York, NY: Raven Press; 1986. pp. 347–390.

Publication types