Multiplex microsatellite marker panels for genetic monitoring of common rat strains
- PMID: 18459711
- PMCID: PMC2654014
Multiplex microsatellite marker panels for genetic monitoring of common rat strains
Abstract
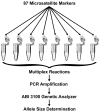
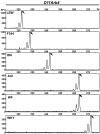
Because microsatellite markers have a high degree of genetic variability, they are an effective tool for genetic monitoring. We have developed a genotyping panel containing 87 microsatellite markers that are polymorphic among commonly used inbred rat strains, including ACI, Fischer 344, Lewis, Brown Norway, Wistar-Furth, and Wistar-Kyoto. The markers are located at approximately 15- to 20-cM intervals along each of the 20 autosomes. By using fluorescently labeled primers and multiplex PCR analysis, the entire genome can be assayed with only 8 reactions. The resulting amplicons from these reactions can be distinguished from one another by both their size and the fluorescent dye associated with them. Amplicons are analyzed and allele sizes are determined by using automated capillary-based instrumentation. These multiplex panels provide a cost-effective and rapid method for genetic monitoring for applications ranging from assessing genetic contamination in a rat colony to moving mutations from one genetic background to another by using a speed congenic approach.
Figures


Similar articles
-
Development of a SNP genotyping panel for genetic monitoring of the laboratory mouse.Genomics. 2004 May;83(5):902-11. doi: 10.1016/j.ygeno.2003.11.007. Genomics. 2004. PMID: 15081119
-
Multi-individual microsatellite identification: A multiple genome approach to microsatellite design (MiMi).Mol Ecol Resour. 2019 Nov;19(6):1672-1680. doi: 10.1111/1755-0998.13065. Epub 2019 Aug 27. Mol Ecol Resour. 2019. PMID: 31339632 Free PMC article.
-
Development of a microsatellite marker set applicable to genome-wide screening of cynomolgus monkeys (Macaca fascicularis).Primates. 2007 Apr;48(2):140-6. doi: 10.1007/s10329-006-0008-z. Epub 2006 Nov 22. Primates. 2007. PMID: 17119865
-
Current trends in microsatellite genotyping.Mol Ecol Resour. 2011 Jul;11(4):591-611. doi: 10.1111/j.1755-0998.2011.03014.x. Epub 2011 May 12. Mol Ecol Resour. 2011. PMID: 21565126 Review.
-
Recent developments in genomewide association scans: a workshop summary and review.Am J Hum Genet. 2005 Sep;77(3):337-45. doi: 10.1086/432962. Epub 2005 Aug 1. Am J Hum Genet. 2005. PMID: 16080110 Free PMC article. Review.
Cited by
-
Genetic boundary and gene flow between 2 parapatric subspecies of brown rats.Curr Zool. 2020 Dec;66(6):677-688. doi: 10.1093/cz/zoaa027. Epub 2020 Jun 9. Curr Zool. 2020. PMID: 33391367 Free PMC article.
-
Fischer-344 Tp53-knockout rats exhibit a high rate of bone and brain neoplasia with frequent metastasis.Dis Model Mech. 2016 Oct 1;9(10):1139-1146. doi: 10.1242/dmm.025767. Epub 2016 Aug 15. Dis Model Mech. 2016. PMID: 27528400 Free PMC article.
-
Multiplex Detection of SNPs for Genetic Monitoring in Laboratory Mice by Luminex xTAG Assay.Genes (Basel). 2024 Dec 19;15(12):1622. doi: 10.3390/genes15121622. Genes (Basel). 2024. PMID: 39766889 Free PMC article.
-
Authentication scheme for routine verification of genetically similar laboratory colonies: a trial with Anopheles gambiae.BMC Biotechnol. 2009 Oct 22;9:91. doi: 10.1186/1472-6750-9-91. BMC Biotechnol. 2009. PMID: 19849838 Free PMC article.
-
A fish is not a mouse: understanding differences in background genetics is critical for reproducibility.Lab Anim (NY). 2021 Jan;50(1):19-25. doi: 10.1038/s41684-020-00683-x. Epub 2020 Dec 2. Lab Anim (NY). 2021. PMID: 33268901 Review.
References
-
- Bender K, Adams M, Baverstock PR, den Bieman M, Bissbort S, Brdicka R, Butcher GW, Cramer DV, von Deimling O, Festing MF, et al. 1984. Biochemical markers in inbred strains of the rat (Rattus norvegicus). Immunogenetics 19:257–266 - PubMed
-
- Deng AY, Dutil J, Sivo Z. 2001. Utilization of marker-assisted congenics to map two blood pressure quantitative trait loci in Dahl rats. Mamm Genome 12:612–616 - PubMed
-
- Ensembl [Internet]. Cambridge (UK): The European Bioinformatics Institute; c1999–2008. Available from: http://www.ensembl.org.
-
- Flaherty L. 1981. Congenic strains. In: Foster H, Small J, Fox J.The mouse in biomedical research, vol. 1. New York: Academic Press; p 215–222
Publication types
MeSH terms
Substances
Grants and funding
LinkOut - more resources
Full Text Sources
Medical
