Identification of heterogeneity among soft tissue sarcomas by gene expression profiles from different tumors
- PMID: 18460215
- PMCID: PMC2412854
- DOI: 10.1186/1479-5876-6-23
Identification of heterogeneity among soft tissue sarcomas by gene expression profiles from different tumors
Abstract
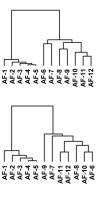
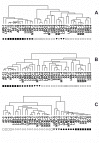
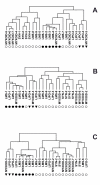
The heterogeneity that soft tissue sarcomas (STS) exhibit in their clinical behavior, even within histological subtypes, complicates patient care. Histological appearance is determined by gene expression. Morphologic features are generally good predictors of biologic behavior, however, metastatic propensity, tumor growth, and response to chemotherapy may be determined by gene expression patterns that do not correlate well with morphology. One approach to identify heterogeneity is to search for genetic markers that correlate with differences in tumor behavior. Alternatively, subsets may be identified based on gene expression patterns alone, independent of knowledge of clinical outcome. We have reported gene expression patterns that distinguish two subgroups of clear cell renal carcinoma (ccRCC), and other gene expression patterns that distinguish heterogeneity of serous ovarian carcinoma (OVCA) and aggressive fibromatosis (AF). In this study, gene expression in 53 samples of STS and AF [including 16 malignant fibrous histiocytoma (MFH), 9 leiomyosarcoma, 12 liposarcoma, 4 synovial sarcoma, and 12 samples of AF] was determined at Gene Logic Inc. (Gaithersburg, MD) using Affymetrix GeneChip U_133 arrays containing approximately 40,000 genes/ESTs. Gene expression analysis was performed with the Gene Logic Genesis Enterprise System Software and Expressionist software. Hierarchical clustering of the STS using our three previously reported gene sets, each generated subgroups within the STS that for some subtypes correlated with histology, and also suggested the existence of subsets of MFH. All three gene sets also recognized the same two subsets of the fibromatosis samples that we had found in our earlier study of AF. These results suggest that these subgroups may have biological significance, and that these gene sets may be useful for sub-classification of STS. In addition, several genes that are targets of some anti-tumor drugs were found to be differentially expressed in particular subsets of STS.
Figures


Similar articles
-
Gene expression analysis of soft tissue sarcomas: characterization and reclassification of malignant fibrous histiocytoma.Mod Pathol. 2007 Jul;20(7):749-59. doi: 10.1038/modpathol.3800794. Epub 2007 Apr 27. Mod Pathol. 2007. PMID: 17464315
-
Characterization of sarcomas by means of gene expression.J Lab Clin Med. 2004 Aug;144(2):78-91. doi: 10.1016/j.lab.2004.04.005. J Lab Clin Med. 2004. PMID: 15322502
-
Gene expression identifies heterogeneity of metastatic behavior among high-grade non-translocation associated soft tissue sarcomas.J Transl Med. 2014 Jun 20;12:176. doi: 10.1186/1479-5876-12-176. J Transl Med. 2014. PMID: 24950699 Free PMC article.
-
Lessons from genetic profiling in soft tissue sarcomas.Acta Orthop Scand Suppl. 2004 Apr;75(311):35-50. doi: 10.1080/00016470410001708310. Acta Orthop Scand Suppl. 2004. PMID: 15188664 Review.
-
Gene expression profiling in sarcomas.Crit Rev Oncol Hematol. 2007 Aug;63(2):111-24. doi: 10.1016/j.critrevonc.2007.04.001. Epub 2007 Jun 6. Crit Rev Oncol Hematol. 2007. PMID: 17555981 Review.
Cited by
-
A Retrospective Analysis of the Efficacy of Immunotherapy in Metastatic Soft-Tissue Sarcomas.Cancers (Basel). 2020 Jul 11;12(7):1873. doi: 10.3390/cancers12071873. Cancers (Basel). 2020. PMID: 32664595 Free PMC article.
-
Biomarkers for immune checkpoint inhibition in sarcomas - are we close to clinical implementation?Biomark Res. 2023 Aug 23;11(1):75. doi: 10.1186/s40364-023-00513-5. Biomark Res. 2023. PMID: 37612756 Free PMC article. Review.
-
Fluorescence-guided assessment of bone and soft-tissue sarcomas for predicting the efficacy of telomerase-specific oncolytic adenovirus.PLoS One. 2024 Feb 20;19(2):e0298292. doi: 10.1371/journal.pone.0298292. eCollection 2024. PLoS One. 2024. PMID: 38377118 Free PMC article.
-
Immunotherapy for Bone and Soft Tissue Sarcomas.Biomed Res Int. 2015;2015:820813. doi: 10.1155/2015/820813. Epub 2015 Jun 17. Biomed Res Int. 2015. PMID: 26167500 Free PMC article. Review.
-
Measured intrapatient radiomic variability as a predictor of treatment response in multi-metastatic soft tissue sarcoma patients.Sci Rep. 2025 Jul 30;15(1):27838. doi: 10.1038/s41598-025-12451-3. Sci Rep. 2025. PMID: 40739225 Free PMC article.
References
-
- Khan J, Wei JS, Ringner M, Saal LH, Ladanyi M, Westermann F, Berthold F, Schwab M, Antonescu CR, Peterson C, Meltzer PS. Classification and diagnostic prediction of cancers using gene expression profiling and artificial neural networks. Nat Med. 2001;7:673–679. doi: 10.1038/89044. - DOI - PMC - PubMed
Publication types
MeSH terms
Substances
Grants and funding
LinkOut - more resources
Full Text Sources
Medical

