. 2008 May 7;3(5):e2088.
doi: 10.1371/journal.pone.0002088.

Long-term activity-dependent plasticity of action potential propagation delay and amplitude in cortical networks

Affiliations

Long-term activity-dependent plasticity of action potential propagation delay and amplitude in cortical networks

Douglas J Bakkum et al. PLoS One. .

Abstract

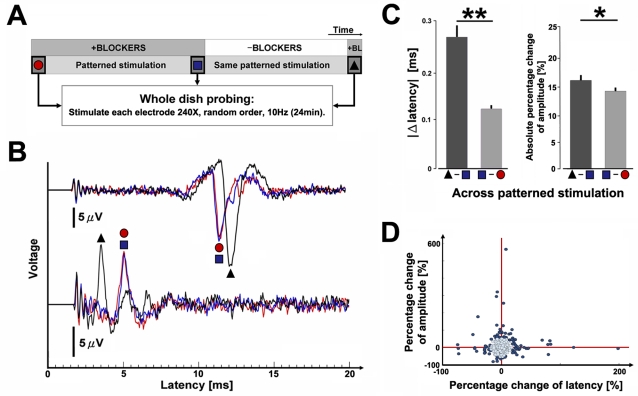
Background: The precise temporal control of neuronal action potentials is essential for regulating many brain functions. From the viewpoint of a neuron, the specific timings of afferent input from the action potentials of its synaptic partners determines whether or not and when that neuron will fire its own action potential. Tuning such input would provide a powerful mechanism to adjust neuron function and in turn, that of the brain. However, axonal plasticity of action potential timing is counter to conventional notions of stable propagation and to the dominant theories of activity-dependent plasticity focusing on synaptic efficacies.

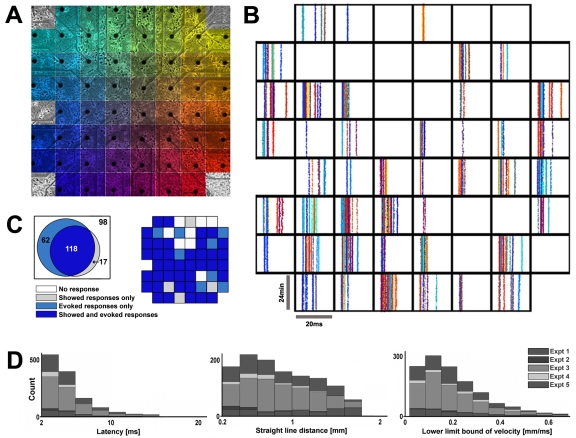
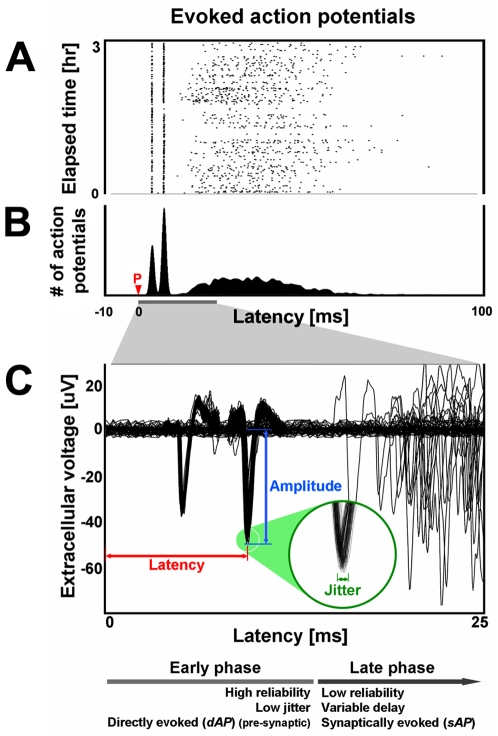
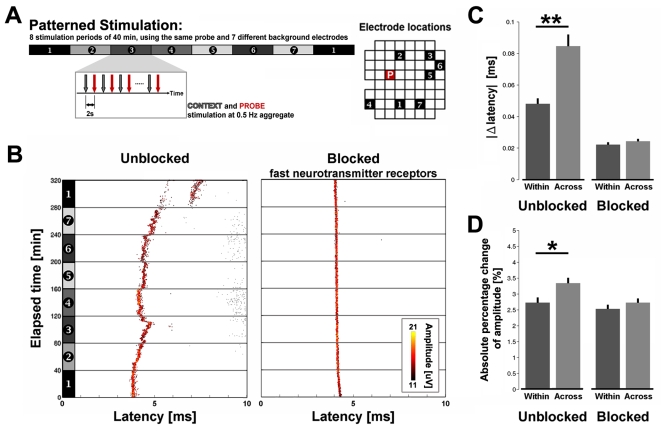
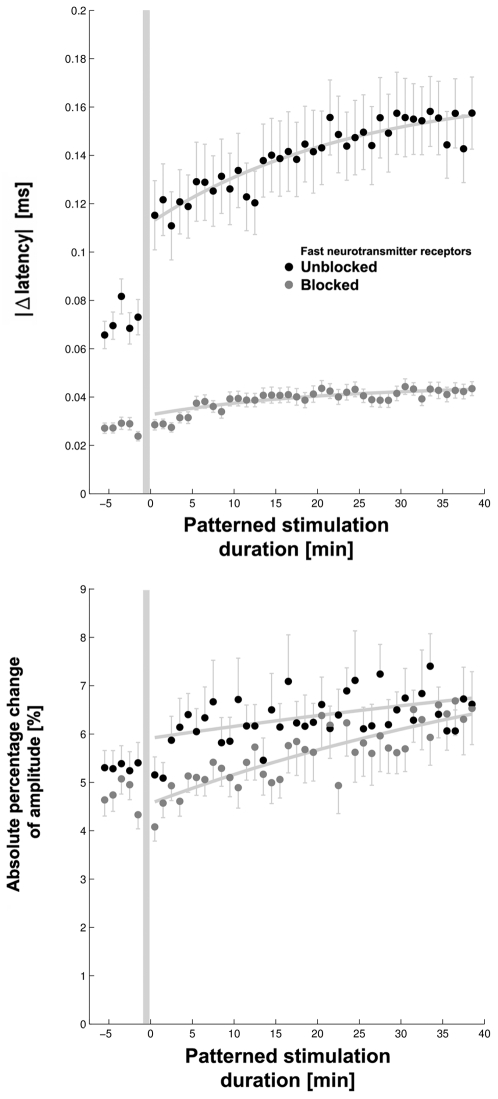
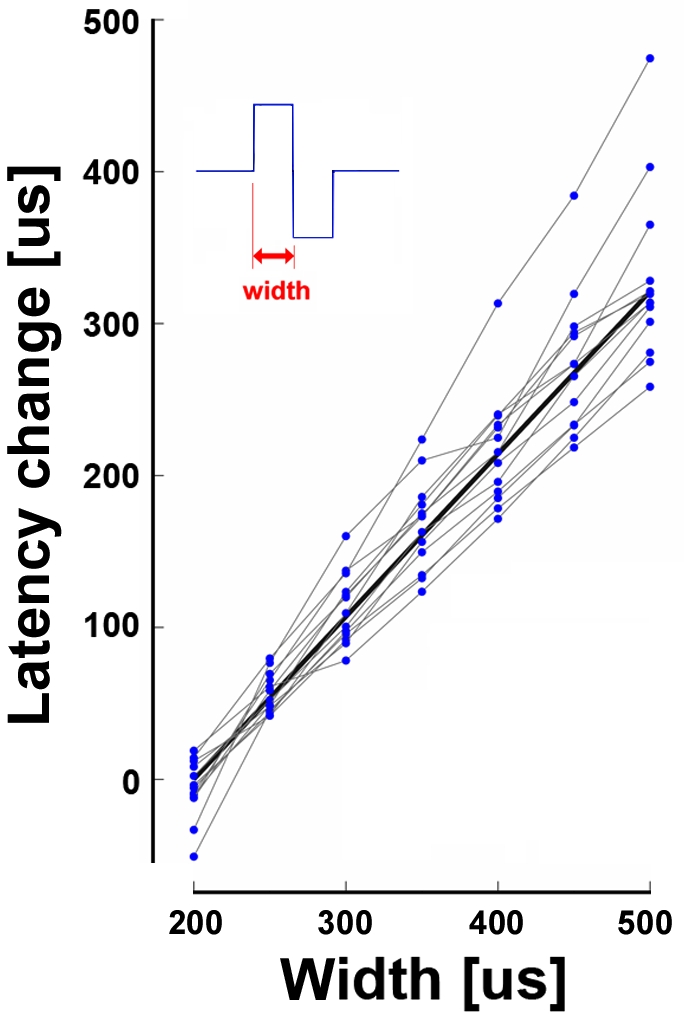
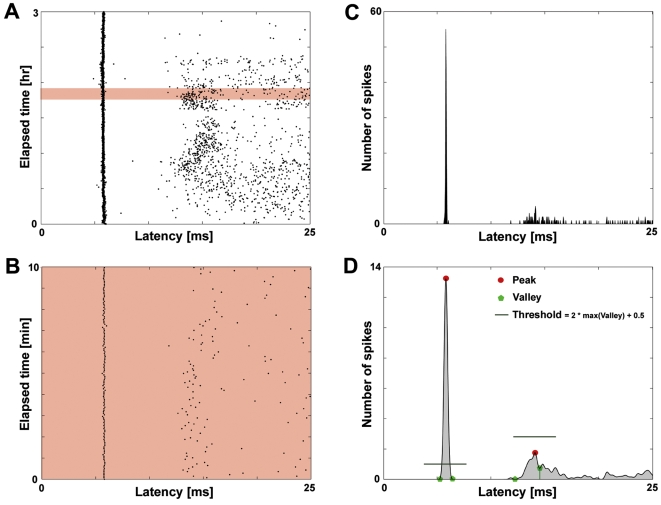
Methodology/principal findings: Here we show the occurrence of activity-dependent plasticity of action potential propagation delays (up to 4 ms or 40% after minutes and 13 ms or 74% after hours) and amplitudes (up to 87%). We used a multi-electrode array to induce, detect, and track changes in propagation in multiple neurons while they adapted to different patterned stimuli in controlled neocortical networks in vitro. The changes did not occur when the same stimulation was repeated while blocking ionotropic gabaergic and glutamatergic receptors. Even though induction of changes in action potential timing and amplitude depended on synaptic transmission, the expression of these changes persisted in the presence of the synaptic receptor blockers.

Conclusions/significance: We conclude that, along with changes in synaptic efficacy, propagation plasticity provides a cellular mechanism to tune neuronal network function in vitro and potentially learning and memory in the brain.


Conflict of interest statement

Competing Interests: The authors have declared that no competing interests exist.

Figures

Figure 1
Figure 1. Multi-electrode arrays (MEA) robustly detected dAPs.
(A) Neurons at 6 days in vitro grown over an MEA with 30 µm diameter electrodes spaced 0.2 mm apart. The large reference electrode is outside the field of view. Color represents the location of the stimulation electrode that evoked the dAPs plotted in B. (B) Recording electrodes (arranged topographically) detected dAPs (dots) in a 4 week-old culture in abundance. (C) Venn diagram comparing the proportion of the electrodes showing and/or evoking dAPs in 5 three to four week-old cultures from 3 dissociations (295 electrodes; data also in Fig. 5). Their incomplete overlap suggests that the location of an extracellularly recorded action potential can differ from the location of an extracellularly evoked action potential within a given neuron. The data from B are presented in the adjacent plot as an example. (D) Histograms of dAP latencies, distances from the stimuli site, and estimated velocities.
Figure 2
Figure 2. Electrically evoked neural activity.
Action potentials recorded on one extracellular electrode in response to stimulation at another consist of an early directly-evoked action potential (dAP) phase and a later synaptically-evoked action potential (sAP) phase. (A) The raster plot (1 dot per action potential) shows the first 100 ms of neural responses to 3 hours of periodic 1/2 Hz probe stimulation (red P). (B) The peri-stimulus time histogram and (C) overlaid extracellular voltage traces across all trials emphasize the consistency of the early phase with respect to the later phase. The sharp peaks in the histogram arise from two dAPs. See also .
Figure 3
Figure 3. Action potential propagation depended on ongoing neural activity and stimulation pattern.
(A) Experiment protocol. 1/4 Hz probe stimuli (red arrows) produced dAPs whose latencies and amplitudes were investigated for plasticity. A context electrode (gray arrows) was stimulated 2 sec prior to each probe stimulus, giving an overall 1/2 Hz stimulation frequency, and its location was shifted every 40 min to produce different patterns of stimulation (numbers and shaded bars). Right: electrode locations for data in B. (B) Example raster plots of a given dAP recorded on one electrode in response to probe stimulation of another electrode in culture media (left, Unblocked; sAPs are plotted with smaller markers) and when blocking sAPs (right, Blocked). Ongoing neural activity modified latency (x axis) and amplitude (color). Varying stimulation pattern (Across) significantly altered (C) dAP latency (**P<1e-6, Wilcoxon signed rank test for paired samples. Unblocked: n = 130 dAP trains; Blocked: n = 115 dAP trains. 6 cultures from 4 dissociations) and (D) amplitude (*P = 0.003) within 5 minutes (mean+s.e.m.). See Results.
Figure 4
Figure 4. Changes in dAP propagation accumulated throughout the 40 minute duration of a patterned stimulation.
DAP latencies (Top) and amplitudes (Bottom), from all experiments in Figure 3, were averaged over 1 minute time-bins and compared to those during the 1 minute time-bin just prior to shifting the location of the context electrode (shaded area). The absolute values of the changes in propagation were then averaged (dots; mean±s.e.m.). Exponential curves (thick lines) fit to the data indicate the rates of adaptation. Blocking sAPs minimized the effect of shifting the patterned stimulation that occurred at time = 0 min).
Figure 5
Figure 5. The cause of plasticity was neural activity, and the site of plasticity was not synaptic.
(A) Experiment protocol. SAPs were blocked to eliminate the influence of ongoing synaptic activity, and 3 identical periods of whole-dish probing (shape and color coded) were applied before and after the 5 hours and 20 minutes of patterned stimulation (Fig. 3A). (B) Example extracellular voltage traces for two separate dAPs during each whole-dish probing period (240 traces averaged). Changes that accrued during the patterned stimulation persisted (blue square to black triangle): they were not reflections of ongoing synaptic activity. Changes were minimal during patterned stimulation in the presence of blockers (red circle to blue square): the accrued changes were not artifacts from the electrical stimulation or replacing media. (C) Statistics for all observations (mean+s.e.m. **P<1e-6 and *P = 0.003. Wilcoxon signed rank test for paired samples. n = 904 dAP trains. 5 cultures from 3 dissociations). (D) Changes in latency were not monotonically correlated to changes in amplitude (P = 0.22, ρ = 0.04; Spearman's rank correlation coefficient). The outlying data points, using an arbitrary cut-off at 10% of the distribution, were plotted with darker dots.
Figure 6
Figure 6. DAPs were time-locked to the downswing of biphasic voltage stimuli.
Latencies of dAPs from 13 stimulation-electrode/recording-electrode pairs (thin lines) were measured from the beginning of voltage stimuli with various pulse widths (inset); sAPs were blocked. The thick line is a linear regression on all data points.
Figure 7
Figure 7. Detecting dAPs.
DAPs were automatically detected and tracked from peaks and valleys in consecutive smoothed post-stimulus time histograms. (A) The first 25 ms of neural activity in response to 1/4 Hz probe stimulation were searched for the occurrence of dAPs in 10 min windows (shaded). (B) Expanded view of the shaded 10 min window in A. (C) A firing rate histogram of the neural activity in B was first constructed. (D) Then, the histogram was smoothed in latency with a Gaussian kernel, and all peaks (red circles) and valleys (green pentagons) were found (only 2 peaks and their corresponding valleys are plotted for clarity). A peak was considered to contain dAPs if it exceeded an empirical threshold.

References

    1. Debanne D. Information processing in the axon. Nat Rev Neurosci. 2004;5:304–316. - PubMed
    1. Clark B, Hausser M. Neural coding: hybrid analog and digital signalling in axons. Curr Biol. 2006;16:R585–588. - PubMed
    1. Shu Y, Hasenstaub A, Duque A, Yu Y, McCormick DA. Modulation of intracortical synaptic potentials by presynaptic somatic membrane potential. Nature. 2006;441:761–765. - PubMed
    1. Alle H, Geiger JR. Combined analog and action potential coding in hippocampal mossy fibers. Science. 2006;311:1290–1293. - PubMed
    1. Izhikevich EM. Polychronization: computation with spikes. Neural Comput. 2006;18:245–282. - PubMed

Publication types

Substances