. 2008 May 7;3(5):e2104.
doi: 10.1371/journal.pone.0002104.

Complex dynamics of osteoclast formation and death in long-term cultures

Affiliations

Complex dynamics of osteoclast formation and death in long-term cultures

Timur Akchurin et al. PLoS One. .

Abstract

Background: Osteoclasts, cells responsible for bone resorption, contribute to the development of degenerative, metabolic and neoplastic bone diseases, which are often characterized by persistent changes in bone microenvironment. We aimed to investigate the dynamics of osteoclast formation and death in cultures that considerably exceeded the length of standard protocol and to design a mathematical model describing osteoclastogenesis.

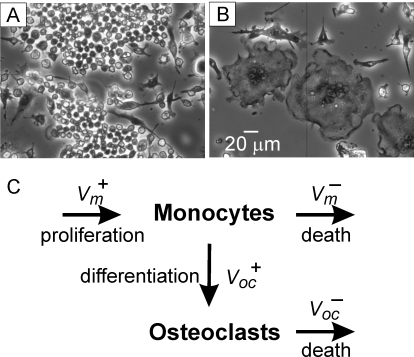
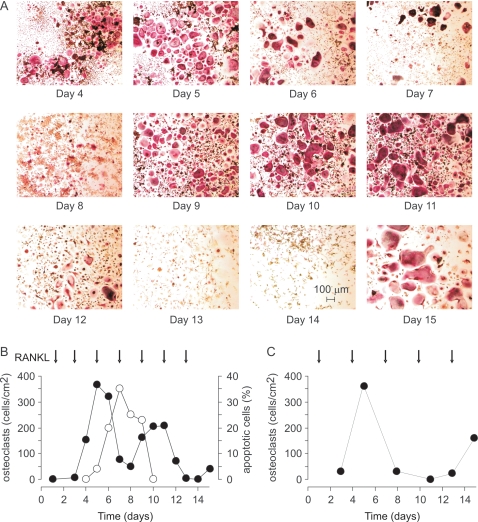
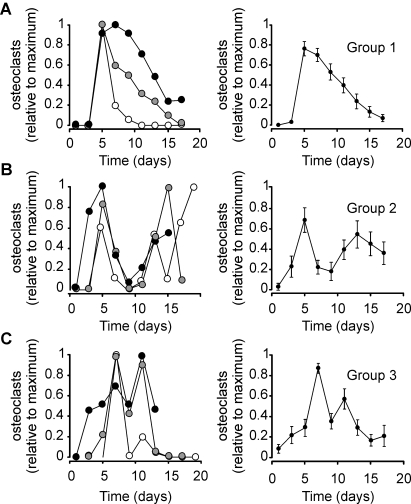
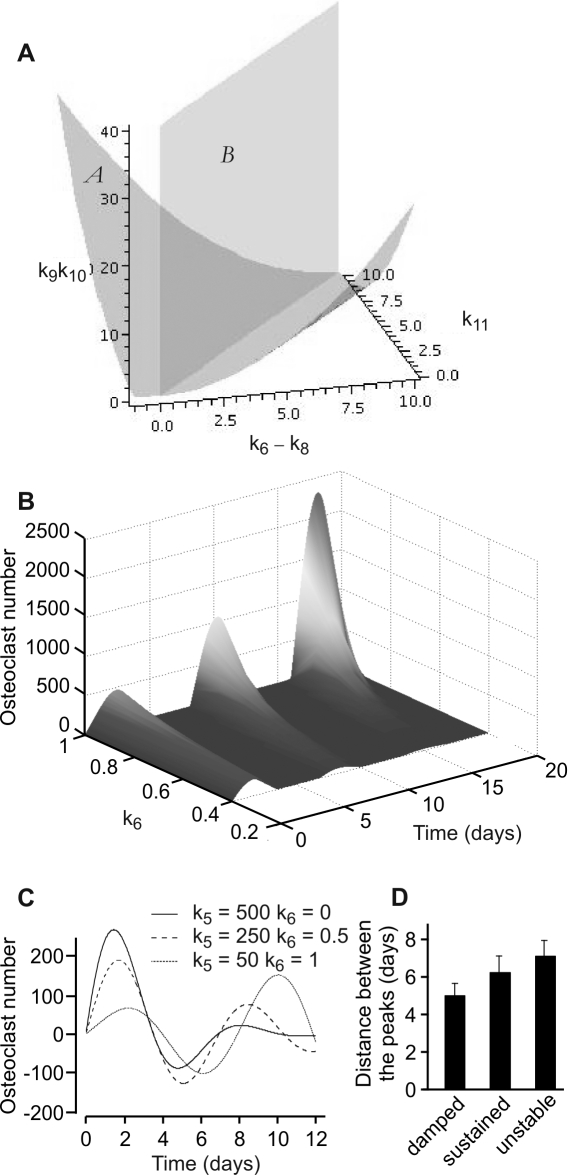
Methodology/principal findings: RAW 264.7 monocytic cells fuse to form multinucleated osteoclasts upon treatment with pro-resorptive cytokine RANKL. We have found that in long-term experiments (15-26 days), the dynamics of changes in osteoclast numbers was remarkably complex and qualitatively variable in different experiments. Whereas 19 of 46 experiments exhibited single peak of osteoclast formation, in 27 experiments we observed development of successive waves of osteoclast formation and death. Periodic changes in osteoclast numbers were confirmed in long-term cultures of mouse bone marrow cells treated with M-CSF and RANKL. Because the dynamics of changes in osteoclast numbers was found to be largely independent of monocytes, a two-species model of ordinary differential equations describing the changes in osteoclasts and monocytes was ineffective in recapitulating the oscillations in osteoclast numbers. Following experimental observation that medium collected from mature osteoclasts inhibited osteoclastogenesis in fresh cultures, we introduced a third variable, factor f, to describe osteoclast-derived inhibitor. This model allowed us to simulate the oscillatory changes in osteoclasts, which were coupled to oscillatory changes in the factor f, whereas monocytes changed exponentially. Importantly, to achieve the experimentally observed oscillations with increasing amplitude, we also had to assume that osteoclast presence stimulates osteoclast formation.

Conclusions/significance: This study identifies the critical role for osteoclast autocrine regulation in controlling long-term dynamic of osteoclast formation and death and describes the complementary roles for negative and positive feedback mediators in determining the sharp dynamics of activation and inactivation of osteoclasts.


Conflict of interest statement

Competing Interests: The authors have declared that no competing interests exist.

Figures

Figure 1
Figure 1. Osteoclasts are formed by fusion of monocytic precursors.
A) Phase contrast micrograph of undifferentiated RAW 264.7 cells grown for 5 days without additions. B) Multinucleated osteoclast-like cells in the culture of RAW 264.7 cells treated for 5 days with RANKL (50 ng/ml). C) Schematic presentation of the processes occurring during osteoclast formation in vitro. Monocytes are depicted to undergo proliferation with the rate Vm + and cell death with the rate of Vm . Osteoclasts are formed by fusion of monocytes with the rate of Voc +. Osteoclast death occur with the rate Voc .
Figure 2
Figure 2. Synchronized waves of osteoclast formation and death observed in long-term cultures.
A, B) RAW 264.7 cells were treated with RANKL 50 ng/ml during 15 days. Samples were fixed, and either stained for TRAP to assess the numbers of TRAP-positive multinucleated osteoclasts, or stained with DAPI to assess nuclear morphology. A) Micrographs of TRAP-stained samples taken at indicated days. Calibration bar applies to all images. B) Black circles: changes in osteoclast numbers during 15 days of culture; open circles: percentage of osteoclasts exhibiting nuclear fragmentation (apoptotic cells), normalized to the total number of osteoclasts. C) Mouse bone marrow cells were treated with MCSF (20 mg/ml) and RANKL (50 ng/ml) during 15 days. Samples were fixed, stained for TRAP, and numbers of TRAP-positive multinucleated osteoclasts were counted. Arrow indicates days when RANKL was added.
Figure 3
Figure 3. Complex dynamics of osteoclast formation and death observed in osteoclast cultures.
RAW 264.7 cells were treated with RANKL, the samples were fixed at different days and the numbers of TRAP-positive multinucleated osteoclasts were assessed. 49 single experiments were normalized to the maximum number of osteoclasts observed in each experiment and binned for a two-day sampling interval. All experiments were divided into 3 groups. A) Group 1 included experiments that exhibited only one peak of osteoclast formation. Left – examples of 3 of 19 individual experiments belonging to group 1. Right – average changes in normalized osteoclast count with time; data are mean±SEM, n = 19 single experiments from 8 different plating dates. B) Group 2 included experiments that exhibited 2 peaks divided by at least 2 points, which had osteoclast count of less then 20% of either peak. Left – examples of 3 of 14 individual experiments belonging to group 2. The experiments were aligned for the time of the first maximum, which in different experiments occurred on day 3 (white circles), day 5 (gray circles) and day 7 (black circles). Right – average changes in normalized osteoclast count with time; data are mean±SEM, n = 14 single experiments from 9 different plating dates, all 14 experiments were aligned for the time of the first maximum. C) Group 3 included experiments that exhibited 2 peaks divided by just one point which had osteoclast count of less then 20% of either peak. Left – examples of 3 of 13 individual experiments belonging to group 3. The experiments were aligned for the time of the first maximum, which in different experiments occurred on day 5 (white circles), day 7 (gray circles) and day 11 (black circles). Right – average changes in normalized osteoclast count with time; data are mean±SEM, n = 13 single experiments from 9 different plating dates, all 13 experiments were aligned for the time of the first maximum.
Figure 4
Figure 4. Comparison of non-oscillating and oscillating groups.
The experiments were divided into non-oscillating group, which contained 19 experiments and oscillating group, which contained 27 experiments (combined groups 2 and 3). Within each group, experiments were divided according to the experimental conditions (plating density and RANKL treatment), and the following parameters were assessed: A, B) We compared the ratio of the proportion of experiments performed with specific conditions in non-oscillating (white bars, Group 1) and oscillating (black bars, Group 2+3) groups to the proportion of experiments performed with that condition in all experiments. A) Plating densities did not affect long-term dynamics of osteoclast cultures. B) RANKL concentration significantly affected the probability of experiment to belong to oscillating group. P<0.05, assessed by χ2 goodness of fit test. C, D) Maximal rate of osteoclast formation was estimated in each experiment and plotted as a function of plating density (C) or RANKL concentration (D). E, F) Maximal rate of osteoclast death was estimated in each experiment and plotted as a function of plating density (E) or RANKL concentration (F). G, H) Maximal number of osteoclast formed in each experiment and plotted as a function of plating density (G) or RANKL concentration (H). C–H) Data are mean±SEM, number of independent experiments are: RANKL (R) 50 ng/ml, plating density (p.d.) 5×10³ cells/cm2: n = 7 (group 1), n = 9 (group 2+3); R 50 ng/ml, p. d. 2.5×10³ cells/cm2: n = 4 (group 1), n = 6 (group 2+3); R 50 ng/ml, p. d. 10×103 cells/cm2: n = 3 (group 1), n = 5 (group 2+3); R 10 ng/ml, p. d. 5×10³ cells/cm2: n = 3 (group 1), n = 2 (group 2+3); R 100 ng/ml, p. d. 5×10³ cells/cm2: n = 2 (group 1), n = 5 (group 2+3).
Figure 5
Figure 5. Estimation of parameters characterizing the dynamics of monocytes and osteoclasts.
RAW 264.7 cells were plated at the density of 2.5×10³ cells/cm2 (triangles), 5×10³ cells/cm2 (squares), 10×103 cells/cm2 (circles) and cultured either untreated (open symbols) or in the presence of RANKL (50 ng/ml, closed symbols). A–D) At indicated times the monocytes were collected from parallel samples and numbers of live and dead cells were counted. A) Changes in monocyte number with time are similar in RANKL treated and untreated cultures. B) Linear dependence of ln(monocyte number) on time indicates first order exponential dynamics for monocyte proliferation. C) The monocytes collected at indicated days from parallel samples, were re-plated on new wells at a density of 5×10³ cells/cm2 and treated with RANKL (black bars) or cultured without RANKL (open bar) for additional 5 days, when the samples were fixed and the numbers of TRAP-positive multinucleated osteoclasts were assessed. Data are mean±SEM, n = 5 independent experiments. D) Numbers of trypan blue positive (dead) monocytes were assessed at each time point and presented as a percentage of total number of monocytes. Data are mean±SD, n = 3 replicates. E) RAW 264.7 cells were plated at the indicated density and cultured in the presence of RANKL (50 ng/ml) for 5 days, when the samples were fixed and the numbers of TRAP-positive multinucleated osteoclasts were assessed. Data are means of 3 replicates for all densities except 2.5×10³, 5×10³, and 10×103 cells/cm2, when data are mean±SEM, n = 9 independent experiments. F) In 3 independent experiments the number of nuclei per osteoclast was assessed in ∼100 osteoclasts per experiment. The data are percentage of osteoclast containing certain number of nuclei from the total of 315 osteoclasts. G) The rate constant of osteoclast death was estimated form the linear dependence of ln(osteoclast number) on time, with day 0 representing the day when maximum of osteoclasts was formed in each experiment. H) During 3 independent experiments, the medium was collected at the indicated day in the end of two-day culture period. RAW 264.7 cells were plated at the density of 5×10³ cells/cm2 and treated with RANKL (50 ng/ml) either without further addition (control) or supplemented with 10% osteoclast conditioned medium collected on indicated day. On day 5 the samples were fixed and the numbers of TRAP-positive multinucleated osteoclasts were assessed. Data are mean±SEM, n = 4 independent experiments, p<0.05, assessed by student t-test.
Figure 6
Figure 6. Dynamics of changes in monocyte and osteoclast numbers predicted by the mathematical model.
A, B) Simulation of changes in monocyte number (A) and osteoclast number (B) obtained using the two-species model described by the equations (4–5), with the following parameters: k 1 = 0.2; 0.4; 0.6; 0.8; 1; 1.2; k 3 = 0.1; k 5 = 300; k 6 = 0; k 8 = 0.3; n = 8. C, D) Simulation of changes in monocyte number (C) and osteoclast number (D) obtained using the three-species model described by the equations (7–9), with the following parameters: k 1 = 1; k 3 = 0.1; k 5 = 300; k 6 = 0.5; k 8 = 0.3; k 9 = 1; k 10 = 1; k 11 = 0.5; n = 8
Figure 7
Figure 7. Positive feedback on osteoclast formation is critical for obtaining oscillations with increasing amplitude.
A) Parametric portrait of the system in the space of parameters k 9 k 10; k 6k 8; k 11. Bifurcation surface (A), described by equation (k 6k 8k 11)2−4k 9 k 10 = 0, separates the regions of non-oscillatory (below the surface), and oscillatory (above the surface) behavior. Bifurcation surface (B), described by equation k 6k 8k 11 = 0, separates the regions of exponential growing and decaying behavior for osteoclasts and factor f. B) Increase in the value of parameter k 6 results in development of oscillations of osteoclast numbers with increasing amplitude. C) Simultaneously increasing the value of parameter k 6 and decreasing the value of parameter k 5 allows simulation of experimental observation that the first peak is generally lower in experiments where osteoclasts oscillate with increasing amplitude compared to experiments without oscillations or with damped oscillations of osteoclasts. D) The 27 experiments where oscillations were observed were classified as damped oscillations, if the amplitude of the second peak was less then 50% of the first peak (n = 10), sustained oscillations, if the amplitude of the second peak was more than 50% but less then 150% of the first peak (n = 9), or unstable oscillations if the amplitude of the second peak was more then 150% of the first peak (n = 8), and the distance between 2 maximums was identified. Data are mean±SEM.

Similar articles

Cited by

References

    1. Stern PH. Antiresorptive agents and osteoclast apoptosis. J Cell Biochem. 2007;101:1087–1096. - PubMed
    1. Grey A. Emerging pharmacologic therapies for osteoporosis. Expert Opin Emerg Drugs. 2007;12:493–508. - PubMed
    1. Karsdal MA, Martin TJ, Bollerslev J, Christiansen C, Henriksen K. Are nonresorbing osteoclasts sources of bone anabolic activity? J Bone Miner Res. 2007;22:487–494. - PubMed
    1. Lawson J. Drug-induced metabolic bone disorders. Semin Musculoskelet Radiol. 2002;6:285–297. - PubMed
    1. Takahashi N, Udagawa N, Kobayashi Y, Suda T. Generation of osteoclasts in vitro, and assay of osteoclast activity. Methods Mol Med. 2007;135:285–301. - PubMed

Publication types