. 2008 May 7;3(5):e2126.
doi: 10.1371/journal.pone.0002126.

Systematic identification of mRNAs recruited to argonaute 2 by specific microRNAs and corresponding changes in transcript abundance

Affiliations

Systematic identification of mRNAs recruited to argonaute 2 by specific microRNAs and corresponding changes in transcript abundance

David G Hendrickson et al. PLoS One. .

Erratum in

  • PLoS ONE. 2008;3(11).doi.org/10.1371/annotation/c8902b4c-30fc-42e7-b506-fc756a3cdd4e

Abstract

microRNAs (miRNAs) are small non-coding RNAs that regulate mRNA stability and translation through the action of the RNAi-induced silencing complex (RISC). Our current understanding of miRNA function is inferred largely from studies of the effects of miRNAs on steady-state mRNA levels and from seed match conservation and context in putative targets. Here we have taken a more direct approach to these issues by comprehensively assessing the miRNAs and mRNAs that are physically associated with Argonaute 2 (Ago2), which is a core RISC component. We transfected HEK293T cells with epitope-tagged Ago2, immunopurified Ago2 together with any associated miRNAs and mRNAs, and quantitatively determined the levels of these RNAs by microarray analyses. We found that Ago2 immunopurified samples contained a representative repertoire of the cell's miRNAs and a select subset of the cell's total mRNAs. Transfection of the miRNAs miR-1 and miR-124 caused significant changes in the association of scores of mRNAs with Ago2. The mRNAs whose association with Ago2 increased upon miRNA expression were much more likely to contain specific miRNA seed matches and to have their overall mRNA levels decrease in response to the miRNA transfection than expected by chance. Hundreds of mRNAs were recruited to Ago2 by each miRNA via seed sequences in 3'-untranslated regions and coding sequences and a few mRNAs appear to be targeted via seed sequences in 5'-untranslated regions. Microarray analysis of Ago2 immunopurified samples provides a simple, direct method for experimentally identifying the targets of miRNAs and for elucidating roles of miRNAs in cellular regulation.


Conflict of interest statement

Competing Interests: The authors have declared that no competing interests exist.

Figures

Figure 1
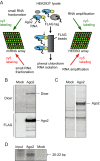
Figure 1. Ago2 association with Dicer and miRNAs.
(A) Strategy for the systematic isolation and identification of RNA associated with Ago2. (B) Immunopurification of FLAG protein purified from mock transfected cells (left) and FLAG-Ago2 transfected cells (right). A Dicer antibody (top) and FLAG antibody (bottom) were immuno-reactive with bands corresponding to the predicted molecular weight of Dicer (∼250 kD) and Ago2 (∼90 kD). (C) SYRO ruby protein stain of FLAG immunopurifications from mock transfected cells (left) and FLAG-Ago2 transfected cells (right). (D) SYBR gold nucleic acid stain of small RNAs (20–40 bp) isolated from whole cell lysate (left), FLAG immunopurification from FLAG-Ago2 transfected cells (middle) and FLAG purification from mock transfected cells (right). Brackets outline expected migration of nucleic acids ∼21 base pairs in length.
Figure 2
Figure 2. Overexpression of FLAG-Ago2 does not perturb overall mRNA expression or miRNA expression.
(A) Unsupervised hierarchical cluster of mRNA levels in HEK293T cells determined relative to a universal reference for RNA from FLAG-Ago2 transfected cells (red) and mock transfected cells (blue). Rows correspond to 12,931 gene elements (representing ∼9,059 genes) and columns represent individual experimental samples (rave = 0.92, Pearson correlation between averaged values from each side of the highest node in the dendrogram). (B) Scatter plot of the normalized log2 microarray signal intensity of 90 expressed miRNAs from whole cell lysates of mock transfected cells (x-axis) versus the normalized log2 microarray signal intensity from Ago2 transfected cells (y-axis, r = 0.98). Values are the averages of 3 experiments. The grey lines delineate the boundary for a two-fold change.
Figure 3
Figure 3. Comparison of mRNA and miRNA specifically associated with Ago2 in the absence or presence of miR-1 or miR-124.
(A) Supervised hierarchical cluster of putative Ago2 targets that are enriched over mock (local FDR 1%) from FLAG purifications of FLAG-Ago2 transfected cells (red) and mock transfected cells (blue). Rows correspond to 1,215 gene elements (representing ∼1,083 genes) and columns represent individual experimental samples. There is a high correlation between replicate experiments: rave = 0.80 for Ago2 replicates, 0.73 for mock replicates, and −0.070 for all experiments. (B) Scatter plot of the normalized log2 microarray signal intensities of 90 miRNAs from whole cell lysate (x-axis) graphed against the normalized log2 microarray signal intensities of miRNAs associated with Ago2 (y-axis, r = 0.92). Four replicates were performed for each experiment. The grey lines delineate the boundary for a two-fold change. (C) Supervised hierarchical clustering of putative miR-1 and miR-124 targets enriched over Ago2 alone (1% local FDR) from FLAG purifications of FLAG-Ago2 transfected cells alone (red) and FLAG-Ago2 transfected cells with miR-1 (green) or miR-124 (purple). Rows correspond to 667 gene features (representing ∼544 genes) and columns represent individual experimental samples. rave = 0.80 for Ago2 replicates, 0.77 for Ago2+miR-1 replicates, 0.90 for Ago2+miR-124 replicates, and 0.43 for all experiments.
Figure 4
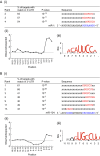
Figure 4. Significantly enriched motifs in 3′-UTRs of mRNAs targeted to Ago2 by miR-1 and miR-124.
(A) Analysis of mRNAs associated with Ago2 from cells transfected with FLAG-Ago2 and miR-1 relative to cells transfected with Ago2 alone (1% local FDR). (i) Enrichment of hexamers in 3′-UTRs of miR-1 IP targets compared to 3′-UTRs of all mRNAs passing array filters. Shown are hexamers with at least four contiguous Watson-Crick base pairs to miRNA with a p-value cut-off of 0.001 (binomial test with bonferroni correction). Rank by p-value relative to all 4096 hexamers. Bases in red can form Watson-Crick base pairs with miR-1. (ii) Moving plot of observed/expected ratios of hexamers complementary to miR-1. Frequencies calculated as in (i). (iii) 10mer motif returned by MEME motif finder using 3′-UTR sequences from the miR-1 high confidence target set. For each position in the motif, the combined height of the bases represents the information content at that position, whereas the relative heights of the individual bases represent the frequency of that base at that position. Bases in red can form Watson-Crick base pairs with miR-1. Numbers underneath the logo correspond with miRNA 5′-position, with 1 being the 5′-most miRNA nucleotide. (B) Same as in (A), except for mRNAs associated with Ago2 from cells transfected with FLAG-Ago2 and miR-124 relative to cells transfected with Ago2 alone.
Figure 5
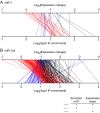
Figure 5. Relationship between overrepresentation in Ago2 IP and changes in mRNA levels due to miR-1 and miR-124.
(A) Lines connect the log2 of the average Ago2 IP enrichment value (bottom axis) to the log2 of the average mRNA expression change (top axis) for three groups of mRNAs from miR-1 experiments. This analysis contains only mRNAs with 7mer seed matches in their 3′-UTRs. Black lines correspond to mRNAs that were Ago2 IP targets (1% local FDR) and decreased significantly at the mRNA level (10% local FDR); seven mRNAs are in this group. Red lines correspond to mRNAs that were Ago2 IP targets but did not decrease significantly at the mRNA level; nevertheless, 20 of 22 mRNAs in this group are downregulated (log2 change<0) at the mRNA level (P<10−5, one-way binomial test). Blue lines correspond to mRNAs that decreased significantly at the mRNA level, but were not Ago2 IP targets; all 9 mRNAs in this group are overrepresented (log2 enrichment>0) in Ago2 IPs (P = 0.0006). (B) Same as in (A) except for mRNAs from miR-124 experiments. 82 mRNAs are in the black group. 109/121 mRNAs in the red group are downregulated at the mRNA level (P<10−15); and 63/65 mRNAs in the blue group are overrepresented in Ago2 IPs (P<10−15).
Figure 6
Figure 6. Comparison of expression changes of mRNAs containing seed matches in 3′-UTRs and coding sequences of miR-1 and miR-124 Ago2 IP targets.
(A) Cumulative distribution of the change in mRNA levels following transfection with FLAG-Ago2 and miR-1 compared to FLAG-Ago2 alone. This analysis included Ago2 IP targets with 3′-UTR 7mer seed matches, but no coding sequence 6mer seed matches (21, red), Ago2 IP targets with coding sequence 7mer seed matches, but no 3′-UTR 6mer seed matches (10, green), and mRNAs that did not contain 3′-UTR or coding sequence 6mer seed matches (2893, black). Changes in mRNA levels of Ago2 IP targets with 3′-UTR 7mer seed matches were greater than those for Ago2 IP targets with coding sequence 7mer seed matches (P = 0.0004), which were in turn greater than those for mRNAs without any 6mer seed matches in the 3′-UTR or coding sequence (P = 0.006). (B) Same as in (A) except for mRNAs associated with FLAG-Ago2 upon transfection with miR-124. There were 81 Ago2 IP targets with 3′-UTR 7mer seed matches but no 6mer coding sequence seed matches (red), 43 Ago2 IP targets with coding sequence 7mer seed matches but no 6mer 3′-UTR seed matches (green), and 1877 mRNAs with no 6mer seed matches in their 3′-UTR or coding sequence. Changes in mRNA levels of Ago2 IP targets with 3′-UTR 7mer seed matches were greater than the changes for Ago2 IP targets with coding sequence 7mer seed matches (P = 0.0005), which in turn were greater than the changes for mRNAs without any 6mer seed matches in the 3′-UTR or coding sequence (P<10−8).
Figure 7
Figure 7. Estimation of the number of miR-1 and miR-124 targets.
(A) Moving average plot (window size of 200) of the fraction of mRNAs with 7mer 3′-UTR seed matches to miR-1. mRNAs were ranked by their SAM enrichment in Ago2 IPs in the presence of miR-1 compared to Ago2 alone, with 1 corresponding to the most enriched mRNA. To determine the point at which the curve first rose above the background level of 7mer seed matches, we first calculated the slope of each least-squares-fit regression line between the right-hand end of the distribution and every point to left of it. The point at which the curve first rose above the background level of 7mer seed matches was determined as the point at which the slope was first negative (vertical grey line). The fraction of mRNAs containing 7mer seed matches to the right of the vertical grey line was considered to be the background level of 7mer seed matches (horizontal grey line). To estimate the total number of targets (pink shaded region), the number of mRNAs to the left of the vertical grey line (3071 of 7805) was multiplied by the fraction of mRNAs to the left of the vertical line containing 7mer 3′-UTR seed matches (0.23) minus the fraction of mRNAs to the right of the vertical line containing 7mer seed matches (0.12). This results in an estimate of 325 targets. (B) Same as in (A), but for miR-124. 6393 of 7817 mRNAs were to the left of the vertical grey line. The fraction of mRNAs with 7mer 3′-UTR seed matches to the left of the grey vertical line was 0.21, while the fraction of mRNAs with 7mer seed matches to the right of the grey vertical lines was 0.07. This results in an estimate of 1000 targets. (C) Same as in (A), except moving average plots of the fraction of mRNAs with 7mer coding sequence seed matches to miR-1. mRNAs with 6mer 3′-UTR seed matches were removed, leaving 4855 mRNAs. 820 mRNAs were to the left of the vertical grey line. The fraction of mRNAs with 7mer seed matches to the left and right of the grey vertical line was 0.24 and 0.14 respectively. This results in an estimate of 83 targets. (D) Same as in (C), but for miR-124. 3312 of 3916 mRNAs were to the left of the vertical grey line. The fraction of mRNAs with 7mer seed matches to the left and right of the grey vertical line was 0.15 and 0.08 respectively. This results in an estimate of 236 targets.

Similar articles

Cited by

References

    1. Ambros V. The functions of animal microRNAs. Nature. 2004;431:350–355. - PubMed
    1. Bartel DP. MicroRNAs: genomics, biogenesis, mechanism, and function. Cell. 2004;116:281–297. - PubMed
    1. Carthew RW. Gene regulation by microRNAs. Curr Opin Genet Dev. 2006;16:203–208. - PubMed
    1. Chen PY, Meister G. microRNA-guided posttranscriptional gene regulation. Biol Chem. 2005;386:1205–1218. - PubMed
    1. Farh KK, Grimson A, Jan C, Lewis BP, Johnston WK, et al. The widespread impact of mammalian MicroRNAs on mRNA repression and evolution. Science. 2005;310:1817–1821. - PubMed

Publication types