. 2008 May 8;2(5):437-47.
doi: 10.1016/j.stem.2008.03.021.

Global transcription in pluripotent embryonic stem cells

Affiliations

Global transcription in pluripotent embryonic stem cells

Sol Efroni et al. Cell Stem Cell. .

Abstract

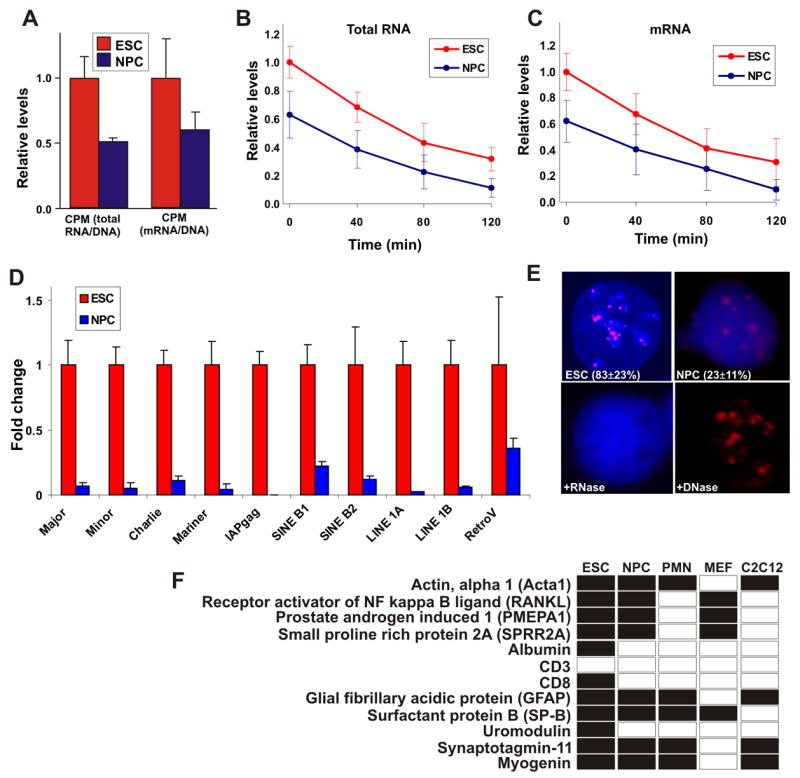
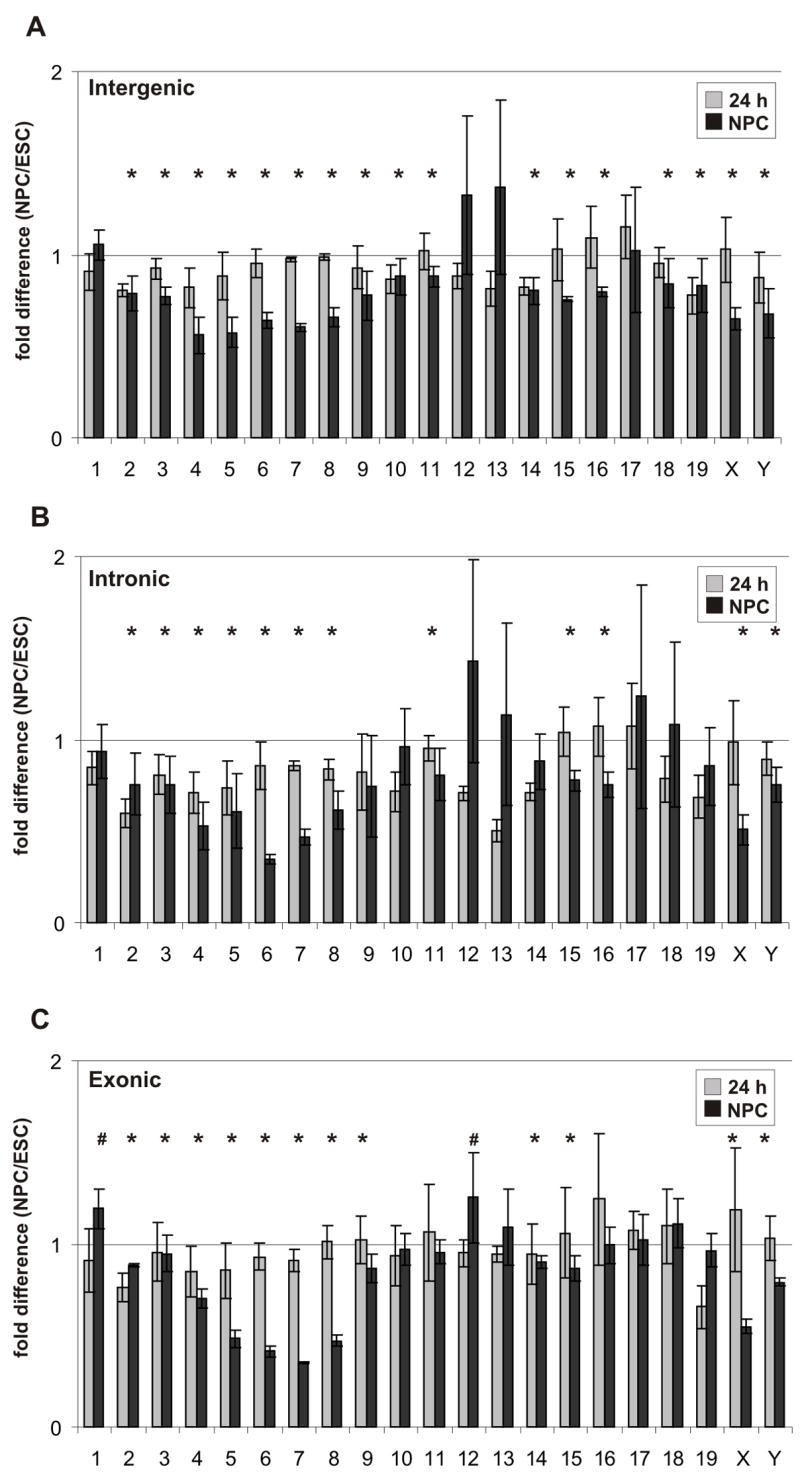
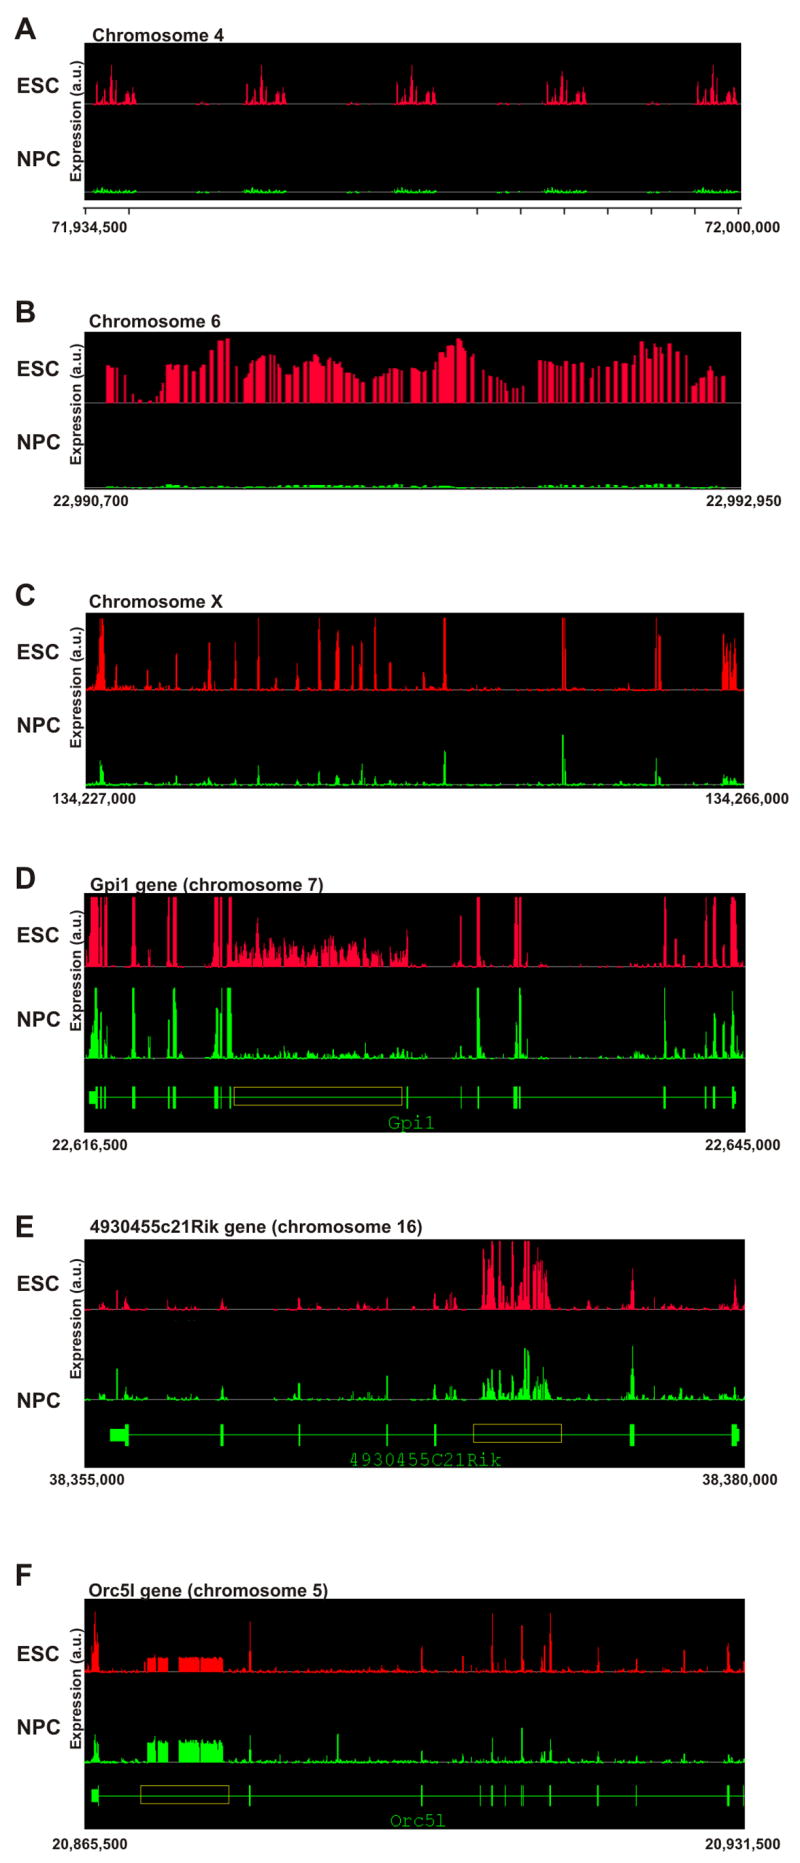
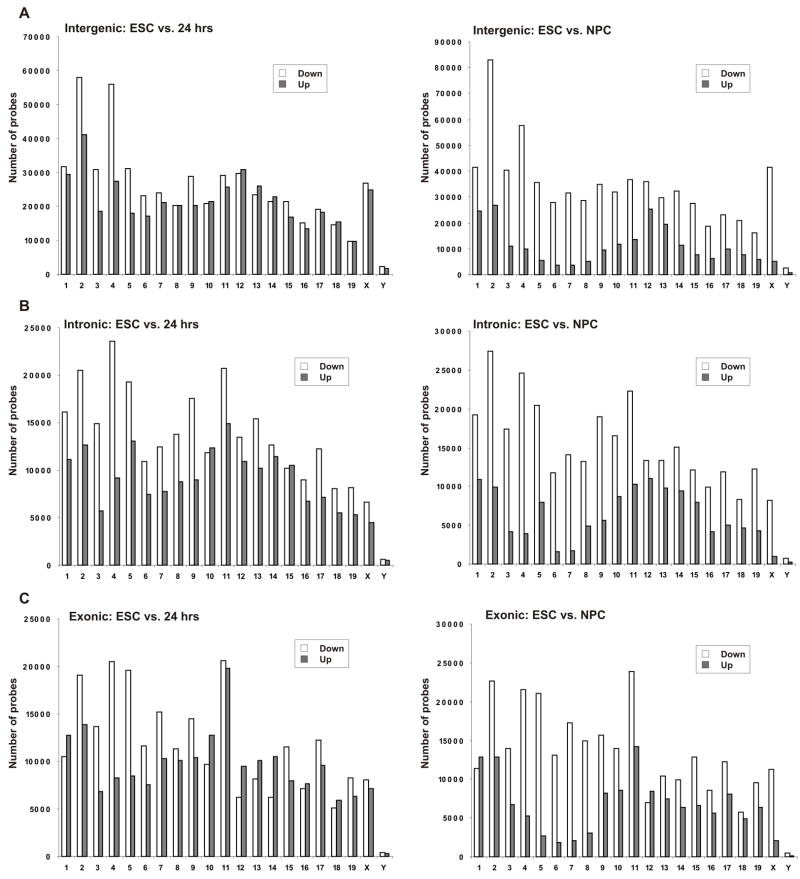
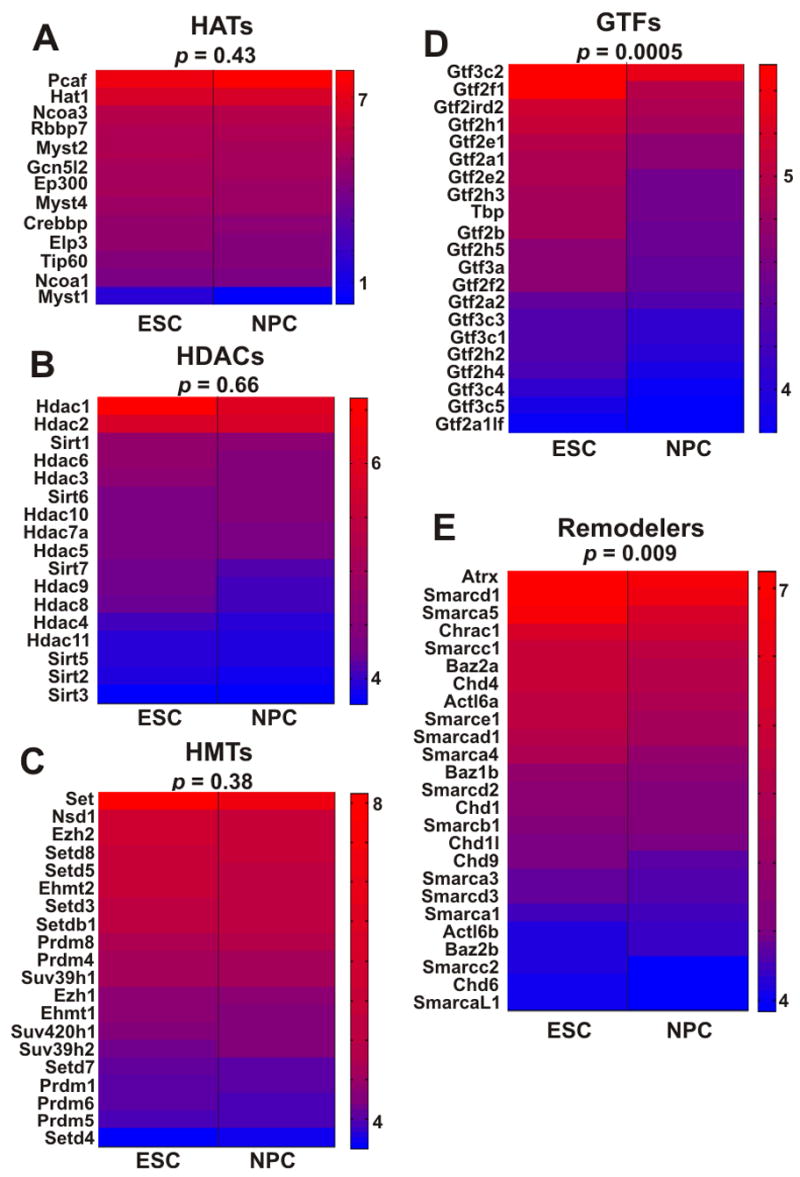
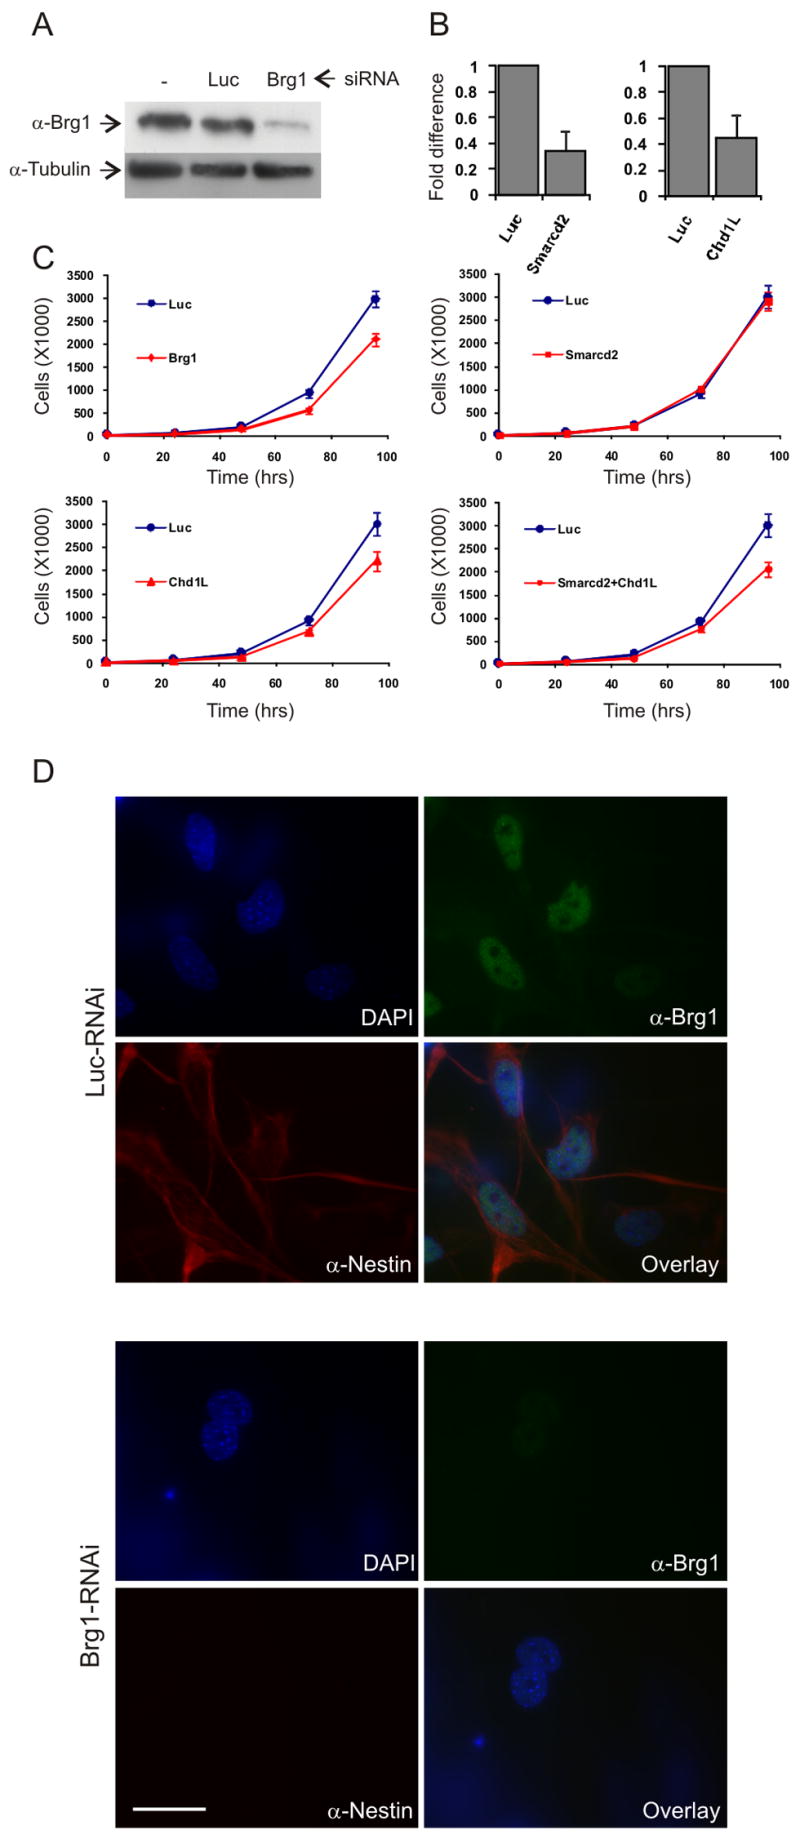
The molecular mechanisms underlying pluripotency and lineage specification from embryonic stem cells (ESCs) are largely unclear. Differentiation pathways may be determined by the targeted activation of lineage-specific genes or by selective silencing of genome regions. Here we show that the ESC genome is transcriptionally globally hyperactive and undergoes large-scale silencing as cells differentiate. Normally silent repeat regions are active in ESCs, and tissue-specific genes are sporadically expressed at low levels. Whole-genome tiling arrays demonstrate widespread transcription in coding and noncoding regions in ESCs, whereas the transcriptional landscape becomes more discrete as differentiation proceeds. The transcriptional hyperactivity in ESCs is accompanied by disproportionate expression of chromatin-remodeling genes and the general transcription machinery. We propose that global transcription is a hallmark of pluripotent ESCs, contributing to their plasticity, and that lineage specification is driven by reduction of the transcribed portion of the genome.


Figures

Figure 1
Figure 1. Elevated global transcription in ES cells
(A) Total RNA transcriptional activity (left) and mRNA transcriptional activity (right) in ES cells (red) and NPC (blue). Cells were incubated with 3H-labeled uridine for 4 hrs. Values represent averages ± SD from 3 experiments. (B–C) As in (a) but following 2 hrs of incubation, 3H-uridine was removed and fresh medium supplemented with 0.125 μM actinomycin-D was added for additional 2 hrs. Samples were collected every 40 min and transcriptional activity of both total RNA (b) and mRNA (c) levels was determined. (D) Real-time quantitative PCR of the indicated repeat sequences and transposable and retroviral elements in ES cells (red) and NPC (blue) normalized against Cyclophilin B. Values represent averages ± SD from 3 independent experiments. (E) RNA-FISH for the major satellite repeat using Cy3-labled locked nucleic acid (LNA) probes in embryonic stem cell (ESC) and ES cells-derived neuronal progenitor cells (NPC). When ES cells were pretreated with RNase A signal was abolished (+ RNase), while DNase I treatment retained the signal (DNase). Values represent averages ± SD from 3 experiments. At least 50 cells were scored per experiment. (F) Lineage-specific transcription in undifferentiated ES cells. Shown is a detection table (black, detected; white, undetected) of a selection of lineage-specific genes detected by RT-PCR in undifferentiated ES cells, NPC, ES cells-derived post-mitotic neurons (PMN), MEFs or differentiated C2C12 cells. Genes were considered not expressed when undetected in 2 independent experiments. Several genes required re-amplification for detection (Figure S3). All samples were treated similarly. For copy number determination see Supplementary Methods.
Figure 2
Figure 2. Whole-genome mouse tiling array analysis
(A–C) Comparison of average fold-difference (± standard deviations) for positive probes from each chromosome between undifferentiated ES cells, cells 24 hrs after LIF withdrawal (gray columns) and NPC (black columns). The fold-difference is depicted relative to the 1.0 fold change shown as a straight line for intergenic regions (A), intronic regions (B) and exonic regions (C). Data are from 3 independent experiments. Asterisks denote significant reduction and number sign (#) denote significant increase between ESC and NPC (p < 0.017). P-values were estimated by one side hypothesis testing, adjusted with Bonferroni correction for multiple comparisons.
Figure 3
Figure 3. Elevated intergenic and intronic transcription patterns in ES cells
Composite graphs depicting signal intensity form the independent biological replicas represent probe intensity per genomic coordinates. All represented coordinates are in the mm.NCBIv33 version of the mouse genome and are indicated below each panel. Y-axis denoted arbitrary units of expression. (A–C) Intergenic transcription. (A) A ~65 kb intergenic region on chromosome 4 displaying repetitive bursts of transcription in ES cells (red, top), but not in neuronal progenitor cells (green, bottom). (B) A 2,250 bp intergenic region on chromosome 6, which is active in ES cells (red, top) but not in NPC (green, bottom). (C) A 29 kb intergenic region on chromosome X, where parts are active in both ES cells and NPC and parts are active in ES cells only. (D–F) Intronic transcription. (D) The annotated region of the Gpi1 gene (~28 kb) on chromosome 7 (green, bottom) shows intronic transcription (yellow box, > 7.5 kb) in both ES cells (red, top) and NPC (green, middle) but transcription level is considerably higher in ES cells. (E) The annotated region of the 4930455C21Rik gene (~25 kb) on chromosome 16 (green, bottom) shows a burst of transcription inside the fifth intron in both ES cells (red, top) and NPC (green, middle). Despite higher expression of the 4930455C21Rik gene in NPC, intronic transcription is higher in ES cells. Note that unlike Gpi1, exons in this case are active at lower levels than the intronic transcription. (F) The annotated region of the Orc5l gene (~66 kb) on chromosome 5 (green, bottom). A long intronic region (yellow box, > 8 kb) inside the Orc5l gene is active. The Orc5l gene itself is also active and the intronic transcription is lower than the exonic transcription. In this example, intronic transcription is higher in NPC (green, middle) than in undifferentiated ES cells (red, top).
Figure 4
Figure 4. Global expression changes during ES cell differentiation
(A–C) Comparison of positive probes between ES cells and cells 24 hrs after LIF withdrawal (left) or between ES cells and neuronal progenitor cells (NPC, right). Total number of down-regulated and up-regulated probes is depicted as white and gray bars respectively for intergenic regions (A), intronic regions (B) and exonic regions (C) for all mouse chromosomes. Only probes which were positive in both time points were used for this analysis. Data represents the average of three independent experiments.
Figure 5
Figure 5. Disproportionate over-representation of general transcription factors and chromatin remodeling genes in undifferentiated ES cells
(A–E) Transcription level heat-maps of different groups of genes that are associated with transcription and regulation of chromatin, including histone acetyltransferases (A), histone deacetylases (B), histone methyltransferases (C), general transcription factors (D) and chromatin remodeling proteins (E). Gene names are given on the left of each map, p values (binomial hypothesis testing) are indicated on top. Chromatin remodeling factors and general transcription factors are disproportionately expressed in ES cells. Heat-maps were generated using microarray signal levels displayed as arbitrary units. Red-to-blue corresponds to high-to-low signal intensity.
Figure 6
Figure 6. Knockdown of specific chromatin remodeling factors inhibits ES cell differentiation
(A) Knockdown of Smarca4 (Brg1) using siRNAs (SmartPool, Dharmacon). Western Blot showing levels of Brg1 protein in ES cells in the absence of siRNA (left), with siRNA against Luciferase (middle) and with siRNA specific to Brg1 (left). Levels of tubulin is used as control (bottom). (B) Real-time RT-PCR of RNA levels after siRNA treatment to Smarcd2 and Chd1L. (C) Proliferation rate of luciferase siRNA treated cells (Luc, blue lines) and of ES cells treated with siRNA against the three chromatin remodeling factors indicated. (D) Top: ES cells-derived NPC treated with luciferase siRNA oligos. Brg1 is shown in green, Nestin in red and DAPI in blue. Lower right panel shows overlay image. Bottom: ES cells treated with siRNA against Brg1 fail to differentiate into NPC. Brg1 is absent in these cells (upper right) and so is Nestin (lower left).

Comment in

References

    1. Aoto T, Saitoh N, Ichimura T, Niwa H, Nakao M. Nuclear and chromatin reorganization in the MHC-Oct3/4 locus at developmental phases of embryonic stem cell differentiation. Dev Biol. 2006;298:354–367. - PubMed
    1. Araki R, Fukumura R, Sasaki N, Kasama Y, Suzuki N, Takahashi H, Tabata Y, Saito T, Abe M. More than 40,000 transcripts, including novel and noncoding transcripts, in mouse embryonic stem cells. Stem Cells. 2006;24:2522–2528. - PubMed
    1. Arney KL, Fisher AG. Epigenetic aspects of differentiation. J Cell Sci. 2004;117:4355–4363. - PubMed
    1. Azuara V, Perry P, Sauer S, Spivakov M, Jorgensen HF, John RM, Gouti M, Casanova M, Warnes G, Merkenschlager M, et al. Chromatin signatures of pluripotent cell lines. Nat Cell Biol. 2006a;8:532–538. - PubMed
    1. Azuara V, Perry P, Sauer S, Spivakov M, Jorgensen HF, John RM, Gouti M, Casanova M, Warnes G, Merkenschlager M, et al. Chromatin signatures of pluripotent cell lines. Nat Cell Biol 2006b - PubMed

Publication types

Substances

Associated data