. 2008 Jun 30;171(2):207-13.
doi: 10.1016/j.jneumeth.2008.03.006. Epub 2008 Mar 27.

3D micro-CT imaging of the postmortem brain

Affiliations

3D micro-CT imaging of the postmortem brain

Alex de Crespigny et al. J Neurosci Methods. .

Abstract

Magnetic resonance microscopy (microMRI) is becoming an important tool for non-destructive analysis of fixed brain tissue. However, unlike MRI, X-ray computed tomography (CT) scans show little native soft tissue contrast. In this paper, we explored the use of contrast enhanced (brains immersion stained in iodinated CT contrast media) micro-CT (microCT) for high resolution 3D imaging of fixed normal and pathological brains, compared to microMRI and standard histopathology. An optimum iodine concentration of 0.27 M resulted in excellent contrast between gray and white matter in normal brain and a wide range of anatomical structures were identified. In glioma bearing mouse brains, there was clear deliniation of tumor margin which closely matched that seen on histopathology sections. microCT tumor volume was strongly correlated with histopathology volume. Our data suggests that microCT image contrast in the immersion-stained brains is related to axonal density and myelin content. Compared to traditional histopathology, our microCT approach is relatively rapid and less labor intensive. In addition, compared to microMRI, microCT is robust and requires much lower equipment and maintenance costs. For simple measurements, such as tumor volume and non-destructive postmortem brain screening, microCT may prove to be a valuable alternative to standard histopathology or microMRI.


Figures

Figure 1
Figure 1
(A) 2D coronal sections through 3D μCT images of the normal rabbit brains. Brains have been soaked in various concentrations of Hypaque or GdDTPA in PBS. Left to right: 100% PBS, 1:20 Hypaque/PBS, 1:10 Hypaque/PBS, 1:5 Hypaque/PBS, 1:67 GdDTPA/PBS. There is no native μCT contrast in the brain soaked in PBS while there is greatest gray/white contrast in the brain soaked in 1:10 Hypaque/PBS. (B) signal (Houndsfield Units) against I127 concentration for ROIs in cortical gray matter and white matter (corpus callosum), as well as the difference signal. (C) image noise (gray matter) and gray/white matter contrast-to-noise ratio against I127 concentration.
Figure 2
Figure 2
Axial sections through normal rabbit brains showing the tissue contrast throughout the brain (A) μCT and (B) μMRI. In spite of the lower resolution obtained with μMRI (75μm) compared to μCT (30μm), the μMR image shows excellent gray/white contrast. Overall, image contrast in the μCT and μMR scans is similar.
Figure 3
Figure 3
Comparison of myelin stained (Loyez) histological sections* (A) and contrast enhanced (Hypaque-76 1:10 dilution) μCT scans through the caudal (top) and rostral (bottom) aspects of a formalin fixed rabbit brain (B). Annotations show some of the brain structures identifiable on both images. Key to structures: (a) Tractus geniculocalcarine, (b) Tractus habenulointercruralis, (c) Radiatio optica, (d) Pedunculus thalami dorsalis, (e) Tractus mamillothalamicus, (f) Tractus opticus, (g) Tapetum, (h) Columna descendens fornicis, (i) Ventriculus tertius, (j) Stria medullaris thalami, (k) Alveus hippocampi, (l) Fimbria hippocampi, (m) Lamina medullaris ventralis thalami, (n) Capsula interna, (o) Zona incerta, (p) Capsula externa, (q) Pes pedunculi cerebri, crus cerebri, (r) Tractus optici accessorii, (s) Corpus callosum, (t) Centrum semiovale, (u) Corona radiata, (v) Tractus olfactorius lateralis, (w) Commissura anterior. (*reproduced with permission from Shek et al. “Atlas of the Rabbit Brain and Spinal Cord”, Karger, 1986)
Figure 4
Figure 4
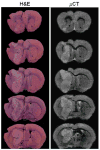
Coronal Hematoxylin and Eosin stained sections and visually matched μCT images through the brain of a mouse with a large glioma in the left hemisphere. The boundary of the tumor is clearly delineated by both imaging methods.
Figure 5
Figure 5
Linear regression of tumor volumes measured by histology and μCT. With the intercept fixed at zero, there was a significant correlation between the two measurement techniques (p=0.0003, R2 = 0.79). The slope was 1.27 which was not significantly different from 1.0.

Similar articles

Cited by

References

    1. Augustinack JC, van der Kouwe AJ, Blackwell ML, Salat DH, Wiggins CJ, Frosch MP, Wiggins GC, Potthast A, Wald LL, Fischl BR. Detection of entorhinal layer II using 7Tesla magnetic resonance imaging. Ann Neurol. 2005;57:489–94. - PMC - PubMed
    1. Barck KH, Lee WP, Diehl LJ, Ross J, Gribling P, Zhang Y, Nguyen K, van Bruggen N, Hurst S, Carano RA. Quantification of cortical bone loss and repair for therapeutic evaluation in collagen-induced arthritis, by micro-computed tomography and automated image analysis. Arthritis Rheum. 2004;50:3377–86. - PubMed
    1. Boyko OB, Alston SR, Fuller GN, Hulette CM, Johnson GA, Burger PC. Utility of postmortem magnetic resonance imaging in clinical neuropathology. Arch Pathol Lab Med. 1994;118:219–25. - PubMed
    1. D’Arceuil H, de Crespigny A. The effects of brain tissue decomposition on diffusion tensor imaging and tractography. Neuroimage. 2007;36:64–8. - PMC - PubMed
    1. D’Arceuil H, Liu C, Levitt P, Thompson B, Kosofsky B, de Crespigny A. Three-Dimensional High-Resolution Diffusion Tensor Imaging and Tractography of the Developing Rabbit Brain. Dev Neurosci. 2007a - PubMed

Publication types