. 2008 Jul;100(1):197-211.
doi: 10.1152/jn.90247.2008. Epub 2008 May 7.

Learning to recognize visual objects with microstimulation in inferior temporal cortex

Affiliations

Learning to recognize visual objects with microstimulation in inferior temporal cortex

Keisuke Kawasaki et al. J Neurophysiol. 2008 Jul.

Abstract

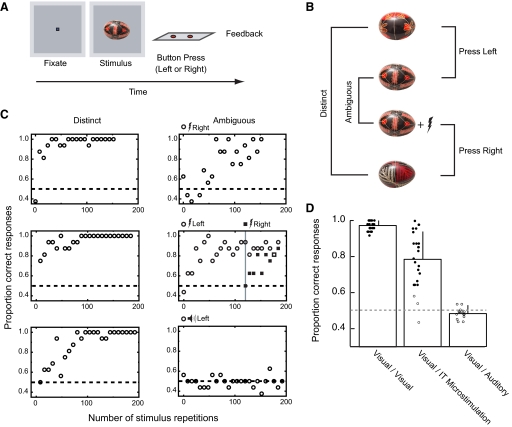
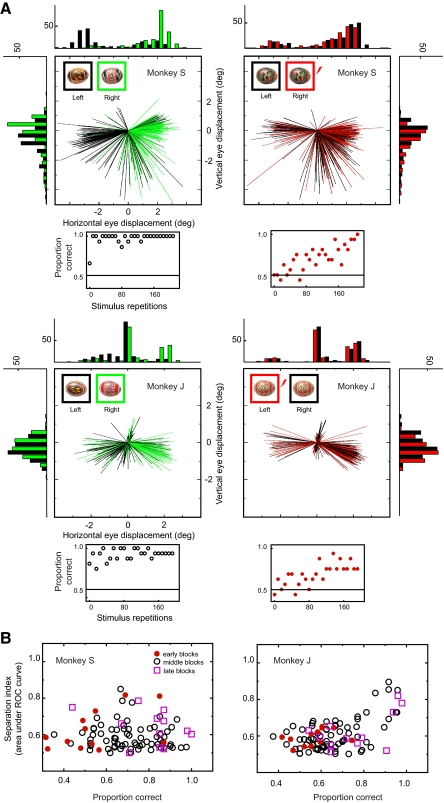
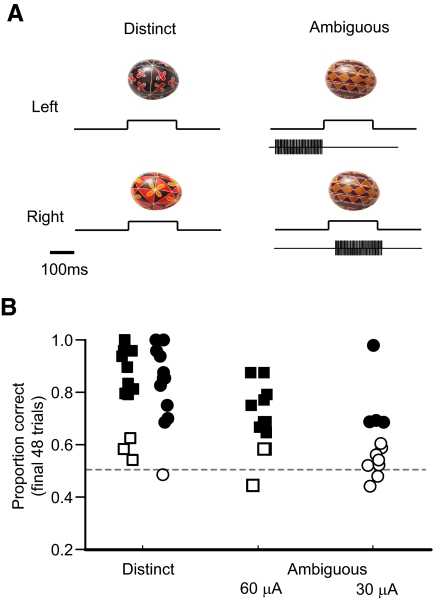
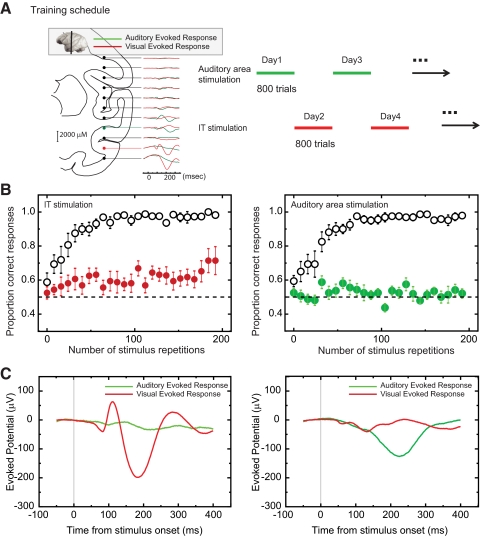
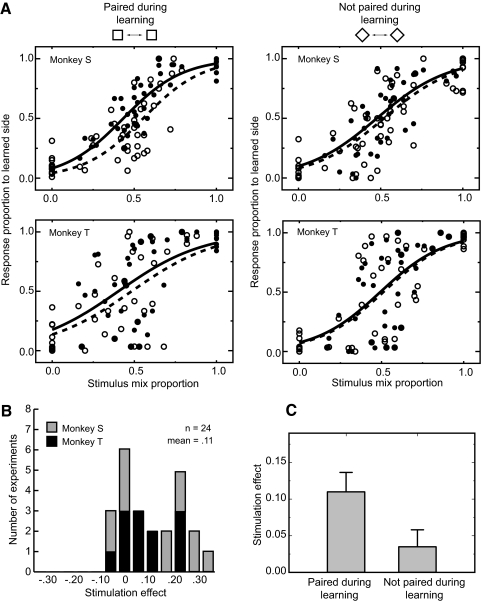
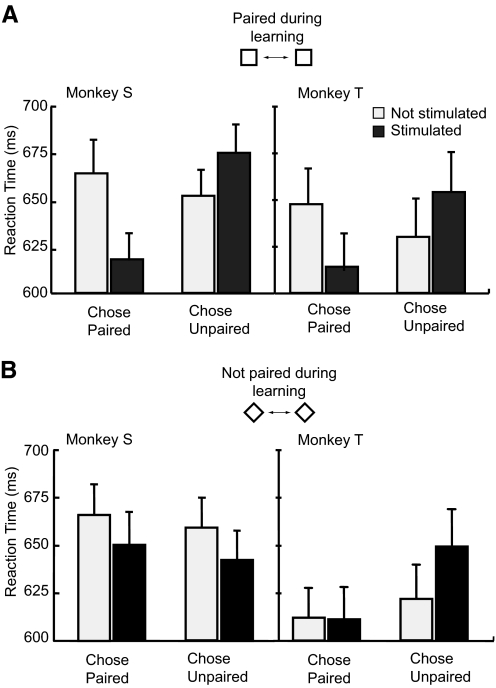
The malleability of object representations by experience is essential for adaptive behavior. It has been hypothesized that neurons in inferior temporal cortex (IT) in monkeys are pivotal in visual association learning, evidenced by experiments revealing changes in neural selectivity following visual learning, as well as by lesion studies, wherein functional inactivation of IT impairs learning. A critical question remaining to be answered is whether IT neuronal activity is sufficient for learning. To address this question directly, we conducted experiments combining visual classification learning with microstimulation in IT. We assessed the effects of IT microstimulation during learning in cases where the stimulation was exclusively informative, conditionally informative, and informative but not necessary for the classification task. The results show that localized microstimulation in IT can be used to establish visual classification learning, and the same stimulation applied during learning can predictably bias judgments on subsequent recognition. The effect of induced activity can be explained neither by direct stimulation-motor association nor by simple detection of cortical stimulation. We also found that the learning effects are specific to IT stimulation as they are not observed by microstimulation in an adjacent auditory area. Our results add the evidence that the differential activity in IT during visual association learning is sufficient for establishing new associations. The results suggest that experimentally manipulated activity patterns within IT can be effectively combined with ongoing visually induced activity during the formation of new associations.


Figures

FIG. 1.
FIG. 1.
Electrical stimulation in inferior temporal cortex (IT) to disambiguate visual patterns. A: single trial in the basic discrimination task consisted of the presentation of a fixation square followed by a visual stimulus for ≤1 s, the monkey's response (left or right button press), and a feedback signal (tone, plus juice reward on correct trials). B: for each session in this experiment, 3 novel images of painted Ukrainian eggs were selected and mapped to button responses as shown. Two of the 3 images were unique and assigned to the left and right buttons (distinct). The 3rd image was assigned to both the left and right buttons and could only be distinguished by accounting for the presence or absence of the electrical stimulation (ambiguous). During the experiment, the 4 stimuli were randomly interleaved on separated trials. C: learning curves for 3 sessions (top and middle rows are from microstimulation sessions, bottom row is from an auditory stimulation session), comparing performance for trials containing the 2 distinct stimuli (left) and the 2 visually ambiguous stimuli (right). Learning in the distinct condition required ∼10 stimulus repetitions to achieve 80% correct performance. In the ambiguous condition, learning proceeded more slowly. The side assigned for ambiguous plus electrical stimulation is denoted on the top of plots. In 1 experiment (middle row), we introduced a 2nd ambiguous set (indicated by a gray vertical line) after learning of the 1st set was complete. The response mapping for the second ambiguous plus stimulation pair was reversed. In this case, the monkey showed a chance level performance for initial trials and proceeded to learn the new mapping without interference from or interfering with performance on the already learned stimuli. D: comparing the effects of electrical microstimulation with auditory stimulation. Bars show average performance for the last 48 trials in conditions where stimuli could be distinguished based on visual differences (Visual/Visual), on the presence or absence of electrical microstimulation (Visual/IT microstimulation), and on the presence or absence of auditory signals (Visual/Auditory). Each circle represents performance from each experiment. Filled circle, session showed significant learning effects; open circle, no significant learning. Performance in the electrical microstimulation condition was clearly superior to that in the auditory condition, showing that integration of disambiguating information does not always occur. Error bars denote SD.
FIG. 2.
FIG. 2.
Initial saccades in the distinct and ambiguous conditions. A: initial saccade trajectory and histograms of saccade endpoints from individual sessions. Positive value in horizontal and vertical eye displacement indicates displacement to the right and up, respectively. Top row: data from monkey S. For a distinct visual stimulus pair (top left panel), saccades for one stimulus, which was assigned to left button pressing (trajectory and histogram shown in black), and another stimulus, which was assigned to right button pressing (trajectory and histogram shown in green), showed a segregated trajectory. Stimuli used for each condition is inset left above of the trajectory panel. For an ambiguous pair (top right panel), saccades showed similar overall profile but no clear separation between unstimulated condition, which was assigned to left button pressing (trajectory and histogram shown in black), and stimulated condition, which was assigned to right button pressing (trajectory and histogram shown in red). Stimuli used for each condition is inset left above of the trajectory panel. A scatter plot placed under the each eye trajectory panel represents behavioral learning curve from the same session. Another example session from monkey J is shown on bottom row. In this case, stimulated condition (trajectory and histogram shown in red) was assigned to left button pressing. B: eye separation and behavioral performance in the ambiguous condition. Population data from monkey S (12 sessions) and monkey J (12 sessions) are shown in left and right panels. Ordinate (for eye separation) shows area under the curve with receiver operating characteristic (ROC) analysis for endpoint positions in horizontal axis. Abscissa (for behavioral performance) shows mean correct rate at the period that the eye separation is calculated. Each point represents data from 24 trial repetitions. Symbols represent learning phase (periods within each session). Red filled circle indicates initial 24 repetitions in the beginning of each session (early blocks). Pink unfilled square indicates last 24 repetitions of each session (late blocks). Unfilled circle indicates middle phase between initials and lasts (middle blocks).
FIG. 3.
FIG. 3.
Sensitivity to relative timing between electrical and visual stimulation. A: the paradigm was similar to that shown in Fig. 1 except that all visually ambiguous trials included a 200-ms train of electrical stimulation (200 Hz, 200 μs width biphasic pulses). New stimuli and stimulation sites were selected for each experiment session. The relative timing between the onset of the electrical and visual stimulus determined the proper button mapping for each ambiguous pair. B: proportion correct for the final 48 trials is shown for both the visual distinct control stimuli (left 2 columns) and the visual/electrical pairs (middle and right columns). With current levels set to 30 μA (circles), learning was evident in 4/12 experiments (filled symbols). At 60 μA (squares), we observed significantly above chance performance in 10/13 experiments (filled symbols).
FIG. 4.
FIG. 4.
Areal specificity of learning effects. A, left: depth profile of local field potentials (LFPs). Illustration of the estimated coronal brain section superimposed on LFPs evoked by auditory (green line) and visual (red line) stimuli. Right: an alternate day training schedule was applied to microstimulation learning in a learning naïve monkey to compare learning rates for stimulation in visual and auditory responsive areas. B, left: averaged learning curve from 10 IT stimulation experiments. Performance (y axis) for distinct condition (unfilled circles) and ambiguous condition (filled red circles) is plotted against number of stimulus repetitions. Right: average learning curve from ten auditory area stimulation experiments. Performance (y axis) for distinct condition (unfilled circles) and ambiguous condition (filled green circles) is plotted against number of stimulus repetitions. Error bars denote SD. C, left: averaged LFP from 10 IT stimulation sites. Right: averaged LFP from 10 auditory area stimulation sites. Red line shows response for visual stimuli. Green line shows response for auditory stimuli. x axis represents time after onset of visual and auditory stimulus. Y axis represents amplitude of LFP.
FIG. 5.
FIG. 5.
The effects of IT microstimulation during visual classification learning when microstimulation is informative, but not required, for classification. A: in this task, 4 new images of stamps were selected before each test session. Random colored noise was added to each stimulus to introduce initial variability during the discrimination task. Two stimuli were shown upright, and 2 were rotated 45°. Microstimulation was included on all trials containing 1 of the 2 upright stimuli (randomly assigned to either the left or right in each session). Thus during learning, 1 of 4 patterns was always experienced with the microstimulation present. Inset: the recorded analog return signal from the stimulating electrode, which verified the timing and amplitude of the microstimulation. The rotated stamps served as control stimuli in each experiment. B: performance plotted as a function of number of stimulus repetitions shows that for this task, the additional microstimulation (filled circles) did not significantly affect learning rates of the patterns assigned to the stimulation condition compared with performance for unstimulated stimuli (open circles). By 100 stimulus repetitions per stimulus, performance was between 90 and 100% for both trial types.
FIG. 6.
FIG. 6.
The effect of electrical microstimulation on the classification choices for novel stimuli composed of image mixtures. A: psychophysical performance from a single behavioral experiment shows the systematic effect of varying the stimulus content from 100% left stimulus to 100% right stimulus. After a learning phase consisting of 100 repetitions for each of the individual stamps, stimulus blends were created by mixing the 2 stamps from the same orientation condition (upright or rotated) in various proportions. A brief pretest with fixed blend ratios (see methods) was administered, and the data were fit to a sigmoid function to estimate the midpoint for response selection (which was not always at the 50% blend level). Three levels of mixing around this subjective midpoint were then used for the main test condition. The abscissa for these plots represents the proportion of the right stimulus at each point, and the ordinate shows the proportion of right responses chosen. At the extremes, the animal's choices were close to perfect and choices between the 2 extremes varied smoothly and systematically as a function of blend proportion. B, left: comparison of stimulated (filled circles) and unstimulated (open circles) trials shows a systematic shift in response proportion upward in the direction of the response associated with the stimulus paired with microstimulation during learning. The microstimulation induced shift was measured as the average response difference between the stimulated and unstimulated conditions in the ambiguous region of the response curve (data appeared on gray background). Right: effect of microstimulation on trials from the same experimental session containing mixtures of images neither of which had been been previously been associated with microstimulation. There is transfer of the effect of microstimulation (for this experiment, microstimulation biased choices to favor the right hand response), but the magnitude of this shift was systematically smaller than that observed for the visual mixtures that included the previously associated image (see Fig. 7).
FIG. 7.
FIG. 7.
Stimulation induced response shifts and a test of stimulus specificity. A: population plots and psychometric functions from monkey S (12 experiments, top row) and monkey T (12 experiments, bottom row). • and ○, responses with and without electrical stimulation, respectively. — and - - -, fitted psychometric functions for trials with and without electrical stimulation. The psychometric function is obtained by logistic regression analysis for the choices made in response to the stimuli mixture containing the image previously been associated with microstimulation (left) and for mixtures wherein neither of the source images had been previously associated with microstimulation (right). B: 24 experiments were conducted in 2 monkeys comparing the response to ambiguous stimulus blends (Fig. 6) with and without stimulation. Effect size (abscissa) is measured in terms of response bias with positive indicating more responses in the direction of the unblended stimulus that had been paired with stimulation during learning. On average, both monkeys showed a significant shift in the expected direction with a mean amplitude across the set of experiments of 11%. C: the specificity of the stimulation effect was assessed by comparing the shift in response bias caused by microstimulation between the blends of upright stamps (which always included the stimulus that had been learned with microstimulation) and the rotated blends. The mean effect size across the 24 experiments decreased by 68% in the transfer condition (P < 0.001, Wilcoxon signed-rank test). Thus the efficacy of the stimulation did depend in part on the interaction between the visual patterns presented and the presence or absence of microstimulation. Error bars denote standard errors.
FIG. 8.
FIG. 8.
Effects of IT microstimulation on reaction times. A: pooled reaction times for ambiguous trials for the response to the stimuli mixture from 1 of which had been previously been associated with microstimulation show that microstimulation affected choice times. Choice reaction times were speeded for stimulated trials in which the monkeys chose the predicted (microstimulation associated) stimulus and were slowed by microstimulation on trials in which the animals chose the unpredicted stimulus (choice × stimulation interaction, monkey S; P < 0.001, monkey T; P < 0.01). Error bars denote 95% confidence intervals. B: pooled reaction times for ambiguous trials in response to the mixtures containing images neither of which had been previously been associated with microstimulation. These data do not show the systematic bias observed for the associated mixtures (choice × stimulation interaction, monkey S; P > 0.2, monkey T; P > 0.1).

References

    1. Afraz SR, Kiani R, Esteky H. Microstimulation of inferotemporal cortex influences face categorization. Nature 442: 692–695, 2006. - PubMed
    1. Baker CI, Behrmann M, Olson CR. Impact of learning on representation of parts and wholes in monkey inferotemporal cortex. Nat Neurosci 5: 1210–1216, 2002. - PubMed
    1. Bisley JW, Zaksas D, Pasternak T. Microstimulation of cortical area MT affects performance on a visual working memory task. J Neurophysiol 85: 187–196, 2001. - PubMed
    1. Bolster B, Crowne DP. Effects of anterior and posterior inferotemporal lesions on discrimination reversal in the monkey. Neuropsychologia 17: 11–20, 1979. - PubMed
    1. Bradley DC, Troyk PR, Berg JA, Bak M, Cogan S, Erickson R, Kufta C, Mascaro M, McCreery D, Schmidt EM, Towle VL, Xu H. Visuotopic mapping through a multichannel stimulating implant in primate V1. J Neurophysiol 93: 1659–1670, 2005. - PubMed

Publication types

LinkOut - more resources