. 2008 Jul;14(7):1297-317.
doi: 10.1261/rna.1082708. Epub 2008 May 7.

Molecular architecture of a miRNA-regulated 3' UTR

Affiliations

Molecular architecture of a miRNA-regulated 3' UTR

Dominic Didiano et al. RNA. 2008 Jul.

Abstract

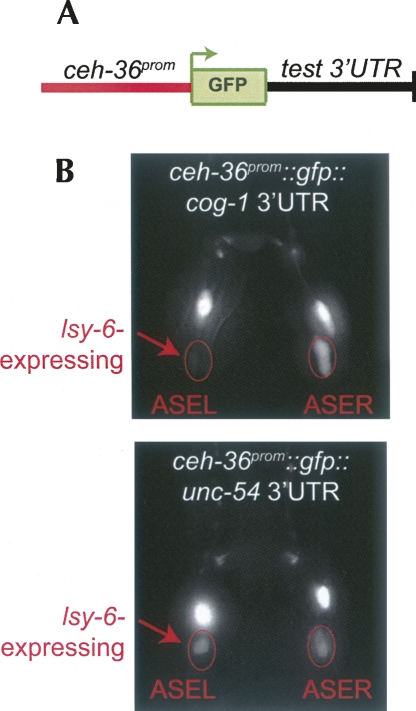
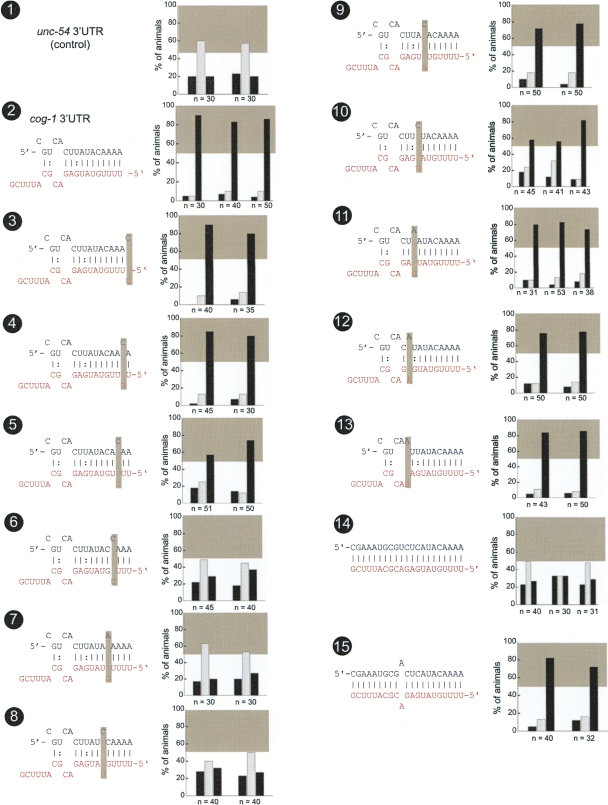
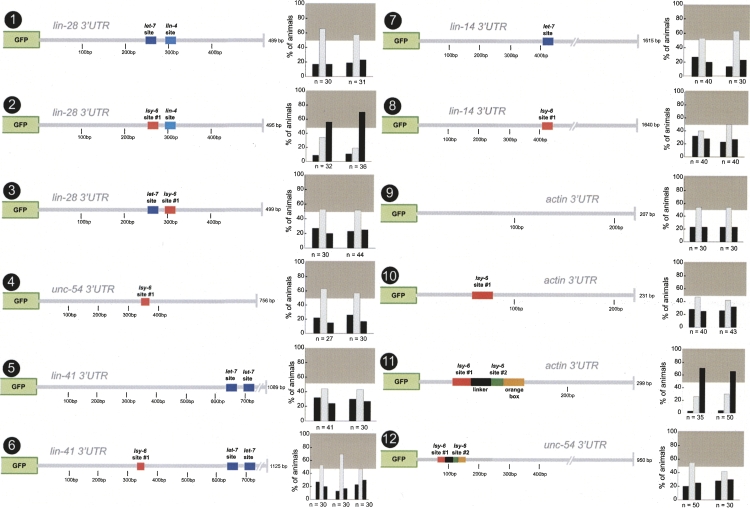
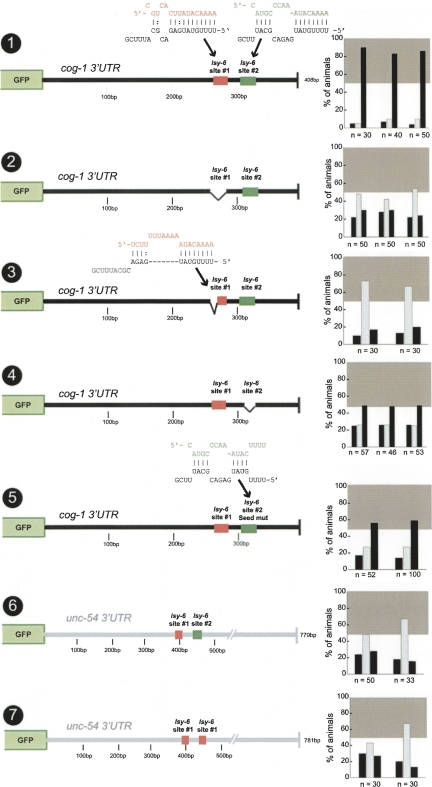
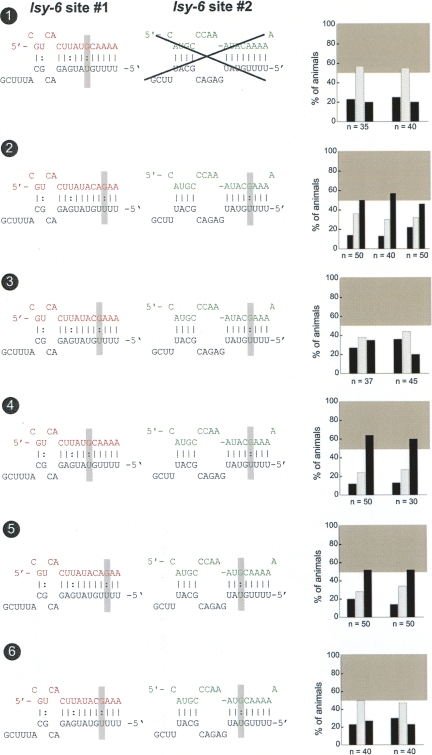
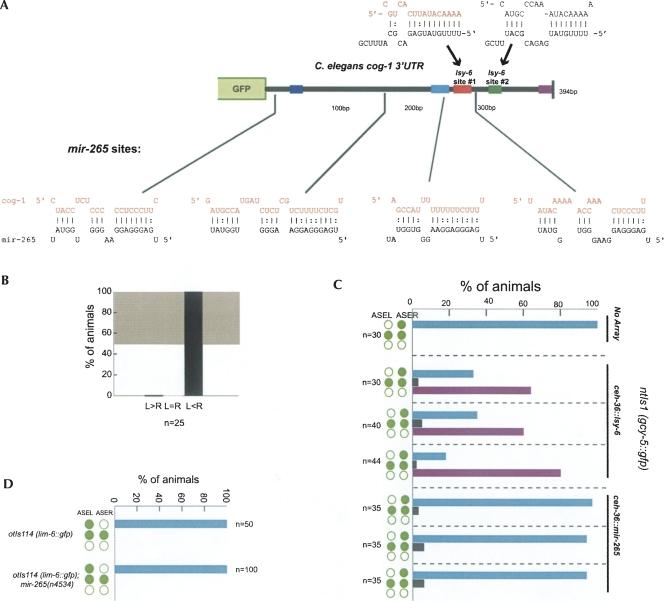
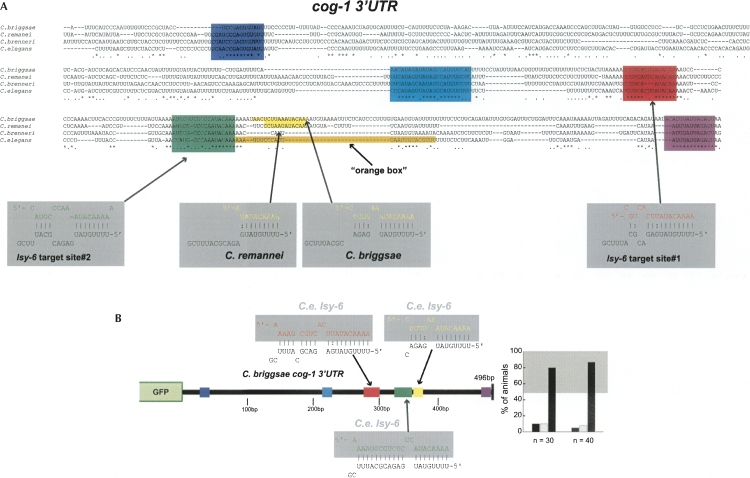
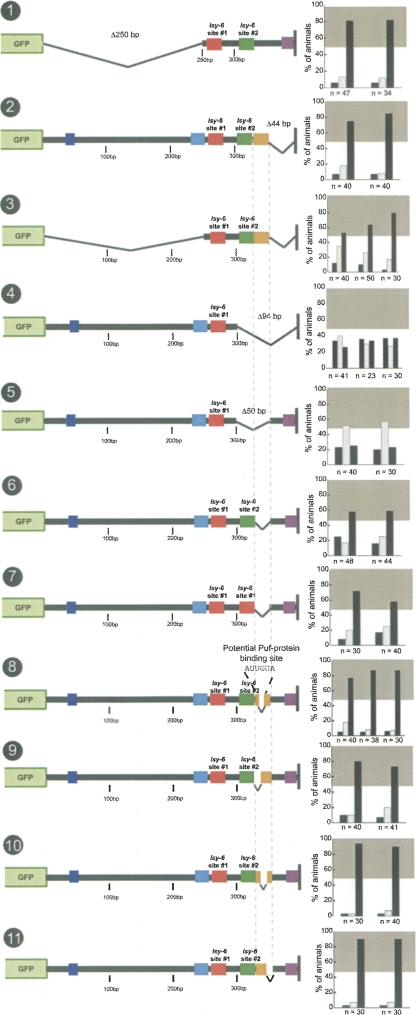
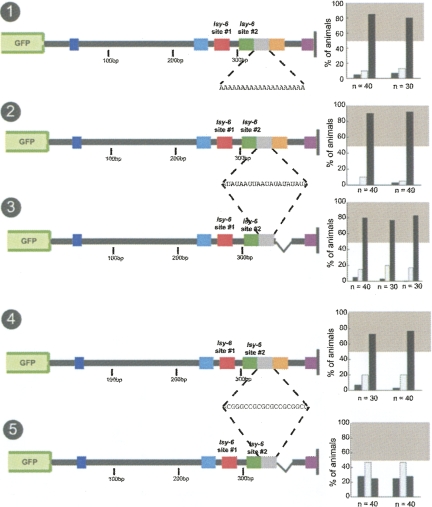
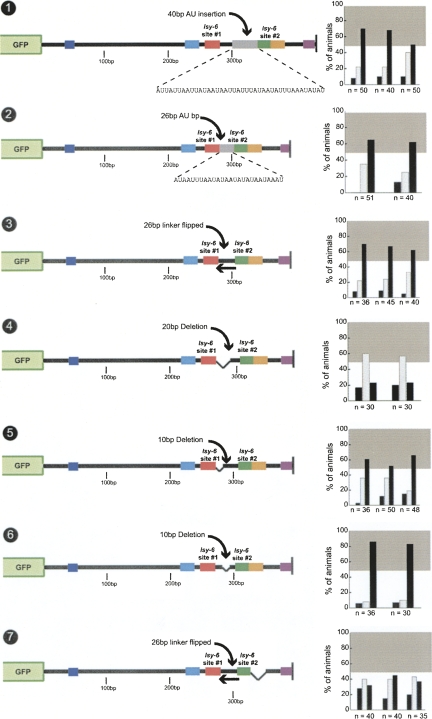
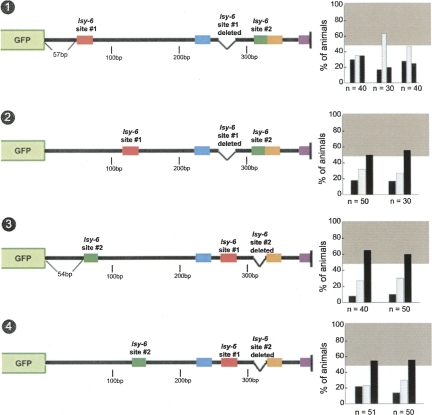
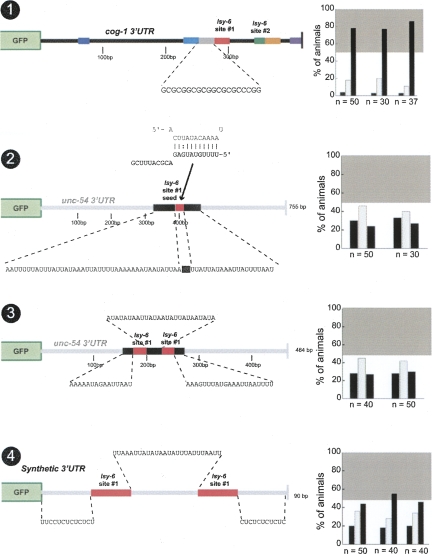
Animal genomes contain hundreds of microRNAs (miRNAs), small regulatory RNAs that control gene expression by binding to complementary sites in target mRNAs. Some rules that govern miRNA/target interaction have been elucidated but their general applicability awaits further experimentation on a case-by-case basis. We use here an assay system in transgenic nematodes to analyze the interaction of the Caenorhabditis elegans lsy-6 miRNA with 3' UTR sequences. In contrast to many previously described assay systems used to analyze miRNA/target interactions, our assay system operates within the cellular context in which lsy-6 normally functions, a single neuron in the nervous system of C. elegans. Through extensive mutational analysis, we define features in the known and experimentally validated target of lsy-6, the 3' UTR of the cog-1 homeobox gene, that are required for a functional miRNA/target interaction. We describe that both in the context of the cog-1 3' UTR and in the context of heterologous 3' UTRs, one or more seed matches are not a reliable predictor for a functional miRNA/target interaction. We rather find that two nonsequence specific contextual features beyond miRNA target sites are critical determinants of miRNA-mediated 3' UTR regulation. The contextual features reside 3' of lsy-6 binding sites in the 3' UTR and act in a combinatorial manner; mutation of each results in limited defects in 3' UTR regulation, but a combinatorial deletion results in complete loss of 3' UTR regulation. Together with two lsy-6 sites, these two contextual features are capable of imparting regulation on a heterologous 3' UTR. Moreover, the contextual features need to be present in a specific configuration relative to miRNA binding sites and could either represent protein binding sites or provide an appropriate structural context. We conclude that a given target site resides in a 3' UTR context that evolved beyond target site complementarity to support regulation by a specific miRNA. The large number of 3' UTRs that we analyzed in this study will also be useful to computational biologists in designing the next generation of miRNA/target prediction algorithms.


Figures

FIGURE 1.
FIGURE 1.
3′ UTR sensor strategy. (A) Schematic representation of 3′ UTR sensor constructs. (B) Example of expression patterns of a regulated (ceh-36∷;gfp-cog-1 3′ UTR) (top) and an unregulated (ceh-36∷;gfp-unc-54 3′ UTR) (bottom) 3′ UTR sensor constructs. These images are the same as shown in Didiano and Hobert (2006) and are shown here again merely as an illustration of our assay system. (Reprinted with permission from Didiano and Hobert 2006; © 1998, Nature Publishing Group [http://www.nature.com/].) lsy-6 is only expressed in ASEL as indicated by arrows. gfp expression is dramatically down-regulated in ASEL but not ASER in the cog-1 3′ UTR sensor construct, but the unc-54 3′ UTR sensor construct displays equal gfp expression in ASEL and ASER. The pair of bright cells above the two ASE cells are the AWCL and AWCR neurons. They serve as internal controls for excluding the scoring of mosaic animals. The degree of regulation can also be quantified using an “asymmetric index” as defined in the Material and Methods and as listed in Supplemental Table 1.
FIGURE 2.
FIGURE 2.
Mutational analysis of lsy-6 site #1. Multiple transgenic animals expressing one given sensor construct are scored for gfp expression. Each scored animal is placed into one of three categories, in which relative gfp expression in the two ASE neurons is as follows: ASEL>ASER (left black bar), ASEL=ASER (middle gray bar), or ASEL<ASER (right black bar). See Material and Methods for more details on scoring. Each set of three bars represents an independent transgenic line. The gray box shown in each bar graph is a visual “helper” to indicate what is considered to be a minimal level of regulation for the system; this minimal regulation is arbitrarily defined based on the level of regulation seen with the lsy-6 site #2 deletion, shown in Figure 4, no. 4. The gray box roughly correlates with another quantitative measure for the degree of regulation, called the “asymmetry index,” defined in the Material and Methods and listed in Supplemental Table 1 for each construct analyzed in this paper. Each construct is named based on figure number and number of construct within the figure. The control unc-54 3′ UTR sensor construct displays characteristic unregulated distribution of gfp (no. 1), while the cog-1 3′ UTR sensors display dramatic regulation with the majority of animals falling into the ASER>ASEL category (no. 2). Shaded boxes indicate location of introduced mismatches. Only mismatches in positions 4, 5, and 6 counting from the 5′ end of the miRNA resulted in complete loss of regulation (nos. 6,7,8). Mismatches in positions 1, 2, 7, 9, 10, and 11 resulted in little or no loss of regulation (nos. 3,4,9,11–13). Mismatches in positions 3 and 8 resulted in a moderate loss of regulation (nos. 5,10). If the lsy-6 target site in the cog-1 3′ UTR is converted to have perfect complementary to lsy-6, then regulation is completely lost. However, if a single mismatch is reintroduced into position 12, which is unpaired in the wild type, then regulation is restored (nos. 14,15). Note: Construct nos. 1, 2, and 7 have been previously examined (Didiano and Hobert 2006) and a rescoring of newly generated and scored transgenic lines is shown here (rescored lines show the same results as previously reported).
FIGURE 3.
FIGURE 3.
Sufficiency of lsy-6 sites in other 3′ UTR contexts. Single copies of the previously described lsy-6 target site from the cog-1 3′ UTR were inserted into the lin-28, unc-54, lin-41, lin-14, and actin/act-1 3′ UTRs (Didiano and Hobert 2006). None of the heterologous contexts displayed regulation prior to target site insertion (nos. 1,5,7,9). The primary target site was inserted into two position of the lin-28 3′ UTR in place of a presumptive let-7 target site and a lin-4 target site (nos. 2,3). Only a single site insertion into the let-7 site position resulted in regulation (no. 2) but failed to confer regulation in the second position (no. 3). The target site was also inserted into a let-7 position in lin-14 3′ UTR (only let-7 but not lin-4 sites are shown for the lin-14 3′ UTR) but failed to display regulation in these contexts (nos. 6,8). A single site was insufficient to confer regulation to an actin 3′ UTR (no. 10). This context was chosen for its short length and high AU content (66% with target site insertion). Additionally, a cog-1 3′ UTR minimal element, which was defined based on deletion analysis in Figure 8 (nos. 1,2,3), conferred regulation to the actin 3′ UTR but not the unc-54 3′ UTR (nos. 11,12). Construct nos. 1, 2, and 4 have been previously examined (Didiano and Hobert 2006), and a rescoring of newly generated and scored transgenic lines is shown here (rescored lines show the same results as previously reported). See legend to Figure 2 and Materials and Methods for explanation of data representation and Figure 2, nos. 1 and 2, for regulated and unregulated control 3′ UTRs.
FIGURE 4.
FIGURE 4.
Asymmetric function of two lsy-6 sites in the cog-1 3′ UTR. Construct no. 1 is the same control as shown in Figure 2, no. 2, and is shown for comparison only. A complete deletion (no. 2) or partial deletion resulting in an 8mer seed region of target site #1 (no. 3) each results in a complete loss of regulation, meaning that target site #2 is nonfunctional in isolation. A complete deletion of site #2 (no. 4) or a seed mutant (no. 5) in site #2 each results in a partial loss of regulation. Either two copies of site #1 or a single copy of site #1 in combination with site #2 were inserted into the unc-54 3′ UTR, but neither of these constructs displayed regulation (nos. 6,7). miRNA/target heteroduplexes shown here were generated using RNAhybrid (Rehmsmeier et al. 2004). Construct no. 3 has been previously examined (Didiano and Hobert 2006) and a rescoring of newly generated and scored transgenic lines is shown here (rescored lines show the same results as previously reported). See legend to Fig. 2 and Materials and Methods for explanation of data representation.
FIGURE 5.
FIGURE 5.
G:U wobble base pairing in the seed region impairs but does not necessarily abolish regulation. Construct no. 1 consists of a G:U wobble base pair in position 6 of site #1 in the background of a site #2 deletion and fails to display regulation. Construct nos. 2–6 were engineered to contain G:U wobble base pairs in both lsy-6 site #1 and site #2. Three of five of these double G:U wobble constructs display intermediate regulation (nos. 2,4,5). Shaded boxes indicate location of G:U wobbles introduced. See legend to Fig. 2 and Materials and Methods for explanation of data representation and Figure 2, nos. 1 and 2, for regulated and unregulated control 3′ UTRs.
FIGURE 6.
FIGURE 6.
mir-265 does not affect cog-1 activity. (A) Potential target sites for mir-265 in the cog-1 3′ UTR shown below 3′ UTR schematic, with lsy-6 target sites shown above. (B) The cog-1 3′ UTR sensor otIs185 (Sarin et al. 2007) is down-regulated normally in the ASEL neuron in mir-265(n4534) null mutant animals. The degree of regulation is the same as shown for the same sensor in a wild-type background (Sarin et al. 2007). (C) The ASE bilateral ceh-36 promoter was used to drive expression of lsy-6 and mir-265 hairpin precursors. ntIs1(gcy-5::gfp) was used as a cell-fate marker to test the ability of lsy-6 and mir-265 to down-regulate cog-1, thereby driving ASEL cell fate in ASER (green circles represent gcy-5::gfp expression pattern as ASER-specific [top], ASE bilateral [middle], or loss of expression [bottom]. All three lines misexpressing lsy-6 results in a “two ASEL phenotype,” as previously reported (Johnston and Hobert 2003). None of the three lines misexpressing mir-265 results in a phenotype, indicating that mir-265 is incapable of downregulating cog-1 via its 3′ UTR in ASER. (D) The mir-265 null mutant n4534 shows no lsy phenotype using the lim-6::gfp ASEL specific reporter (otIs114). Green circles indicate reporter expression in ASEL and ASER.
FIGURE 7.
FIGURE 7.
Evolutionary conservation of the cog-1 3′ UTR. (A) Alignment of cog-1 3′ UTR between C. elegans and three related nematode species. Asterisk (*) indicates perfect conservation; period (.) indicates conservation across any three of the four species. Conserved motifs shown in various colors (dark blue, light blue, and purple). We arbitrarily define conserved motifs as being at least 10-bp long and displaying >66% conservation across all four species. C. elegans lsy-6 heteroduplexes with target sites from the C. elegans cog-1 3′ UTR are shown in red for site #1 and green for site #2. Two of the four species, C. briggsae and C. remanei, also contain a third potential lsy-6 target site shown in yellow. The “orange box” is a sequence in the C. elegans 3′ UTR that we find to contribute to 3′ UTR regulation (Fig. 8). (B) cog-1 3′ UTR regulation is conserved across phylogeny. The C. briggsae cog-1 3′ UTR confers down-regulation in ASEL when expressed in C. elegans. See Figure 2, nos. 1 and 2, for controls. See the legend to Figure 2 and Materials and Methods for explanation of data representation.
FIGURE 8.
FIGURE 8.
Mutational dissection of the cog-1 3′ UTR. The first 250 bp and last 44 bp of the cog-1 3′ UTR are not required for regulation (nos. 1,2). and base pairs 258–350 of the cog-1 3′ UTR alone are sufficient for regulation (no. 3). However, this minimal element is not sufficient in all heterologous contexts (nos. 11,12). A deletion of the last 94 bp of the cog-1 3′ UTR results in a complete loss of regulation (no. 4). A deletion of 300–350 bp results in a complete loss of regulation (no. 5). Deletion of 325–350 bp results in a partial loss of regulation (no. 6). This region does not affect lsy-6 target site #2. Replacing site #2 with a second copy of site #1 in the background of a 325- to 350-bp deletion resulted in slightly increased, but sub-wildtype regulation (no. 7). This 25-bp motif contains a potential PUF-protein binding site, but a deletion of this site had no affect on regulation (no. 8). Scanning deletion analysis of the 25-bp motif by two 8-bp and a 9-bp deletion did not recapitulate the 25-bp deletion effect on regulation (nos. 9,10,11). See legend to Figure 2 and Materials and Methods for explanation of data representation and Figure 2, nos. 1 and 2, for regulated and unregulated control 3′ UTRs.
FIGURE 9.
FIGURE 9.
Functional analysis of the orange box. Distancing the 25-bp orange box from lsy-6 site #2 by a 20-bp A or a AU spacer does not affect regulation (nos. 1,2). Deleting the orange box in the presence of the 20-bp AU spacer does not result in a reduction of regulation (no. 3). Distancing the 25-bp orange box from site #2 with a 20-bp GC spacer also does not affect regulation (no. 4), but deleting the orange box in this context results in a complete loss of regulation (no. 5). See legend to Fig. 2 and Materials and Methods for explanation of data representation and Figure 2, nos. 1 and 2, for regulated and unregulated control 3′ UTRs.
FIGURE 10.
FIGURE 10.
A 26-bp linker between lsy-6 site #1 and #2 provides contextual information that is length independent. Insertion of a 40-bp AU spacer 3′ to the endogenous 26-bp spacer between the two target sites in the cog-1 3′ UTR results in a partial loss of regulation (no. 1). Replacing the endogenous linker with a 26-bp AU linker (no. 2) or inverting the linker also resulted in a partial loss of regulation (no. 3). A 20-bp deletion that shortens the linker to 6 bp results in a complete loss of regulation (no. 4). Only one of two separate 10-bp deletions of the linker region resulted in a reduction of regulation (no. 5), indicating that the deletion that had an effect was due to contextual changes rather than in a reduction of the linker regions length below an ideal length (nos. 5,6). This may be due to contextual changes or reduction of the linker below a critical length or a combination of both. Combining the linker inversion mutation with a deletion of the orange box, examined in Figures 8 and 9, renders the cog-1 3′ UTR virtually nonfunctional (no. 7). See legend to Figure 2 and Materials and Methods for explanation of data representation and Fig. 2, nos. 1 and 2, for regulated and unregulated control 3′ UTRs.
FIGURE 11.
FIGURE 11.
lsy-6 target sites in the cog-1 3′ UTR are only fully functional in endogenous positions in the 3′ UTR. lsy-6 target site #1 displays no regulation when moved to one position but displays weak regulation when moved to a second position within the cog-1 3′ UTR (nos. 1,2). Similarly, moving site #2 to the same positions within the cog-1 3′ UTR results in a level of regulation similar to those displayed by a site #2 deletion (nos. 3,4, see also Fig. 4, no. 4). This indicates that site #1 and site #2 are only capable of achieving wild-type levels of regulation when they are in their endogenous positions. See legend to Figure 2 and Materials and Methods for explanation of data representation.
FIGURE 12.
FIGURE 12.
The AU-richness of the sequence flanking target sites does not correlate with functionality. Inserting 20 bp of GCs 5′ to target site #1 in the cog-1 3′ UTR, distancing the site from a conserved AU-rich sequence, has no effect on the level of regulation (no. 1). Inserting the seed region of target site #1 into an AU-rich region in the unc-54 3′ UTR fails to confer regulation (no. 2). Construct no. 3 is a shortened unc-54 3′ UTR in which two copies of site #1 are inserted into an AU-rich region with a 26-bp AU linker region between the sites; this construct also fails to display regulation. Construct no. 4 is a completely synthetic 3′ UTR consisting of two copies of site #1 also with a 26-bp AU linker surrounded by CU base pairs. This construct displays weak levels of regulation. Note that all engineered linker regions are 26 bp long, which is the length of the linker region between the two target sites in the cog-1 3′ UTR. Construct no. 4 consists of 16 bp from the cog-1 3′ UTR that contains the entire target site #1, whereas all other site #1 insertions are 25-bp sequences from the cog-1 3′ UTR. See legend to Figure 2 and Materials and Methods for explanation of data representation and Fig. 2, nos. 1 and 2, for regulated and unregulated control 3′ UTRs.

References

    1. Bartel D.P. MicroRNAs. Genomics, biogenesis, mechanism, and function. Cell. 2004;116:281–297. - PubMed
    1. Beitzinger M., Peters L., Zhu J.Y., Kremmer E., Meister G. Identification of human microRNA targets from isolated argonaute protein complexes. RNA Biol. 2007;4:76–84. - PubMed
    1. Bentwich I., Avniel A., Karov Y., Aharonov R., Gilad S., Barad O., Barzilai A., Einat P., Einav U., Meiri E., et al. Identification of hundreds of conserved and nonconserved human microRNAs. Nat. Genet. 2005;37:766–770. - PubMed
    1. Brennecke J., Stark A., Russell R.B., Cohen S.M. Principles of microRNA-target recognition. PLoS Biol. 2005;3:e85. doi: 10.1371/journal.pbio.0030085. - DOI - PMC - PubMed
    1. Bushati N., Cohen S.M. microRNA functions. Annu. Rev. Cell Dev. Biol. 2007;23:175–205. - PubMed

Publication types

MeSH terms