. 2008:4:189.
doi: 10.1038/msb.2008.27. Epub 2008 May 6.

Network-based global inference of human disease genes

Affiliations

Network-based global inference of human disease genes

Xuebing Wu et al. Mol Syst Biol. 2008.

Abstract

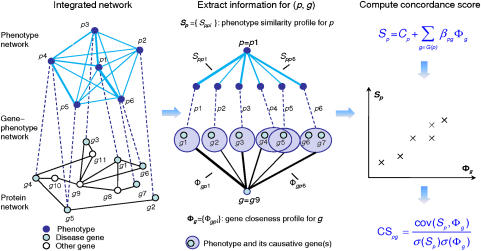
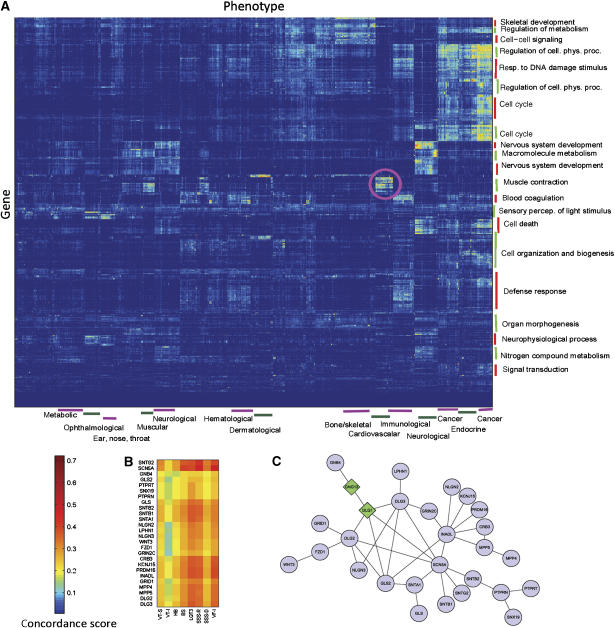
Deciphering the genetic basis of human diseases is an important goal of biomedical research. On the basis of the assumption that phenotypically similar diseases are caused by functionally related genes, we propose a computational framework that integrates human protein-protein interactions, disease phenotype similarities, and known gene-phenotype associations to capture the complex relationships between phenotypes and genotypes. We develop a tool named CIPHER to predict and prioritize disease genes, and we show that the global concordance between the human protein network and the phenotype network reliably predicts disease genes. Our method is applicable to genetically uncharacterized phenotypes, effective in the genome-wide scan of disease genes, and also extendable to explore gene cooperativity in complex diseases. The predicted genetic landscape of over 1000 human phenotypes, which reveals the global modular organization of phenotype-genotype relationships. The genome-wide prioritization of candidate genes for over 5000 human phenotypes, including those with under-characterized disease loci or even those lacking known association, is publicly released to facilitate future discovery of disease genes.


Figures

Figure 1
Figure 1
Scoring scheme of CIPHER. First, the human phenotype network, protein network, and gene–phenotype network are assembled into an integrated network. Then, to score a particular phenotype–gene pair (p, g), the phenotype similarity profile for p is extracted and the gene closeness profile for g is computed from the integrated network. Finally, the linear correlation of the two profiles is calculated and assigned as the concordance score between the phenotype p and the gene g.
Figure 2
Figure 2
Performance of CIPHER on linkage intervals and the whole genome. (A) Score threshold plotted against precision. (B) The precision-recall curve when score threshold varies. (C) The percentage of known disease genes contained in the top-ranked proportion of genes in the ranked genome. The zoom-in plot shows details of the curve in top 5% of the ranked genome.
Figure 3
Figure 3
Modular organization of the predicted genetic landscape of human diseases. (A) Hierarchical clustering of the concordance scores between 8919 genes and 1126 phenotypes. The color of each cell represents the concordance score of a phenotype (column) and a gene (row), where red/blue indicates high/low concordance score. Phenotype clusters are annotated with enriched disease categories (bottom) and gene clusters are annotated with the most enriched biological process terms of GO (right). The pink circled region indicates a module composed of a gene set of muscle contraction involving in a set of cardiovascular diseases. (B) Zoom-in plot of part of the pink circled region, involving 8 cardiovascular diseases and 26 highly related genes. VT-S: ventricular tachycardia, stress-induced polymorphic [MIM 604772]; VT-I: ventricular tachycardia, idiopathic [MIM 192605]; HB: heart block, non-progressive [MIM 11390]; BS: Brugada syndrome [MIM 601144]; LQT3: long QT syndrome-3 [MIM 603830]; SSS-R: sick sinus syndrome, autosomal recessive [MIM 608567]; SSS-D: sick sinus syndrome, autosomal dominant [MIM 163800]; VF-I: ventricular fibrillation, idiopathic [MIM:603829]. (C) Protein interaction network of the 26 genes (circles) and 2 other genes (diamond) linking GNB4 to the main component.
Figure 4
Figure 4
BRCA1 subnetwork. (A) Six genes found to participate in three interacting pairs by MARSMotif are linked to BRCA1/BRCA2 by protein–protein (pp) interactions. (B) Hierarchical clustering of the six genes according to their similarity of function (Gene Ontology Biological Process annotation).

References

    1. Adie EA, Adams RR, Evans KL, Porteous DJ, Pickard BS (2005) Speeding disease gene discovery by sequence based candidate prioritization. BMC Bioinformatics 6: 55. - PMC - PubMed
    1. Aerts S, Lambrechts D, Maity S, Van Loo P, Coessens B, De Smet F, Tranchevent LC, De Moor B, Marynen P, Hassan B, Carmeliet P, Moreau Y (2006) Gene prioritization through genomic data fusion. Nat Biotechnol 24: 537–544 - PubMed
    1. Aloy P (2007) Shaping the future of interactome netwoks. Genome Biol 8: 316. - PMC - PubMed
    1. Bader GD, Betel D, Hogue CWV (2003) BIND: the biomolecular interaction network database. Nucleic Acids Res 31: 248–250 - PMC - PubMed
    1. Barabasi AL (2007) Network medicine—from obesity to the ‘Diseasome'. N Engl J Med 357: 404–407 - PubMed

Publication types