. 2008 Jun 19;453(7198):1132-6.
doi: 10.1038/nature06923. Epub 2008 May 7.

Midzone activation of aurora B in anaphase produces an intracellular phosphorylation gradient

Affiliations

Midzone activation of aurora B in anaphase produces an intracellular phosphorylation gradient

Brian G Fuller et al. Nature. .

Abstract

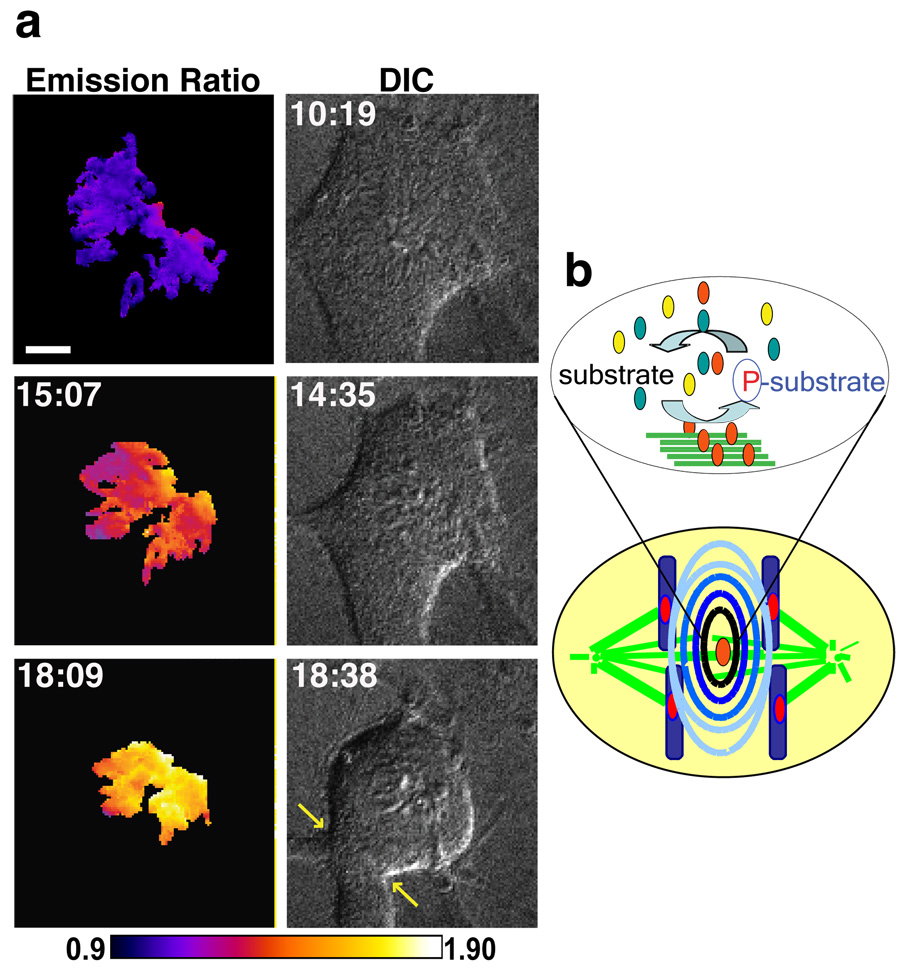
Proper partitioning of the contents of a cell between two daughters requires integration of spatial and temporal cues. The anaphase array of microtubules that self-organize at the spindle midzone contributes to positioning the cell-division plane midway between the segregating chromosomes. How this signalling occurs over length scales of micrometres, from the midzone to the cell cortex, is not known. Here we examine the anaphase dynamics of protein phosphorylation by aurora B kinase, a key mitotic regulator, using fluorescence resonance energy transfer (FRET)-based sensors in living HeLa cells and immunofluorescence of native aurora B substrates. Quantitative analysis of phosphorylation dynamics, using chromosome- and centromere-targeted sensors, reveals that changes are due primarily to position along the division axis rather than time. These dynamics result in the formation of a spatial phosphorylation gradient early in anaphase that is centred at the spindle midzone. This gradient depends on aurora B targeting to a subpopulation of microtubules that activate it. Aurora kinase activity organizes the targeted microtubules to generate a structure-based feedback loop. We propose that feedback between aurora B kinase activation and midzone microtubules generates a gradient of post-translational marks that provides spatial information for events in anaphase and cytokinesis.


Figures

Figure 1
Figure 1. A FRET-based sensor of Aurora B kinase activity demonstrates a spatial phosphorylation gradient during anaphase
a, Sensor design: phosphorylated threonine underlined, targeting sequences from histone H2B (chromatin) or CENP-B (centromere). b, Cells expressing cytosolic (untargeted), chromatin-targeted, or centromere-targeted sensors were imaged live through anaphase. The YFP/CFP emission ratio at each timepoint was normalized to vary from 0–100% and averaged over multiple cells (N≥4). c–e, Cells expressing the centromere-targeted sensor were imaged through anaphase, either with an intact checkpoint (c) or with Mad2 depleted by RNAi (d–e). Left panels (c,d): unprocessed YFP images, right panels: color-coded images of the emission ratio, timestamps (min) relative to anaphase onset, scale bars 5 um. In a plot of all timepoints (e), each circle represents an individual centromere characterized by time after anaphase onset, position along the division axis, and emission ratio (color scale). Dashed lines indicate data points plotted in Fig. S4.
Figure 2
Figure 2. The anaphase phosphorylation gradient is observed for multiple Aurora B substrates
a, A cell expressing the chromatin-targeted Aurora B sensor was imaged live through anaphase. Top panels: unprocessed YFP images, bottom panels: color-coded images of the YFP/CFP emission ratio, timestamp (min) relative to anaphase onset, scale bar 5 µm. b, Average emission ratio (±stdev) plotted vs. position, at time=2.1 min, for pixels binned according to position along the division axis. c, HeLa cell fixed and stained to label chromosomes (DAPI, blue), H3(S10) phosphorylation (green), and Aurora B (red). d, Xenopus S3 cell fixed and stained for DAPI (blue), MCAK (green), and phospho-MCAK(S196) (red). e–f, Intensity profiles of phospho-H3(S10) (green) and DAPI (blue), or MCAK (green) and phospho-MCAK(S196) (red), measured along lines in merged images (c,d). The ratio of phospho-MCAK(S196) to MCAK is calculated at the indicated points (numbers in parenthesis).
Figure 3
Figure 3. The phosphorylation gradient requires Aurora B localization to the midzone
a–f, HeLa cells treated with nocodazole for 8 min (a,d), shRNA against MKLP2 (b,e), or mock transfected (c,f) were fixed and stained for chromosomes (DAPI, blue), H3(S10) phosphorylation (green), and Aurora B (red). Intensity profiles (d–f) show H3(S10) phosphorylation (green) and DAPI (blue) measured along lines in merged images, with distance increasing away from the midzone. g–k, Xenopus S3 cells treated for 8 min with either Hesperadin (g), nocodazole (h), or DMSO (i) were fixed and stained for chromosomes (DAPI, blue), tubulin (green), and phospho-INCENP(S850) (red). Total cellular INCENP and phospho-INCENP(S850) in anaphase were measured by quantitative confocal microscopy (j–k) (mean±sem, n≥10, *p<0.005). I, Antibodies against tubulin and Aurora B were used in a proximity ligation in situ assay (P-LISA) in an anaphase Xenopus S3 cell: PLISA product (red), tubulin (blue), kinetochores (NDC80, light blue). Scale bars 5 µm.
Figure 4
Figure 4. The phosphorylation gradient in a monopolar anaphase predicts the cleavage site
a–d, Cells expressing either the chromatin-targeted sensor (a–b) or Aurora B-GFP (c–d) were depleted of Mad2 by RNAi and imaged through anaphase in the presence of the kinesin-5 inhibitor monastrol. Unprocessed YFP images (a) show chromosome movement relative to the cell perimeter (outlined in white), and color coded images show the YFP/CFP emission ratio (b). Aurora B-GFP (c) redistributes to the cortex, with chromosomes and cleavage furrow visualized by DIC (d). Timestamps min:sec. Scale bar 5 um. e, Model: Following activation on midzone microtubules, Aurora B remains active until dephosphorylation by cytosolic phosphatases. The resulting phosphorylation gradient (contour lines) extends from the midzone to the cortex (yellow ovals -Aurora B complex, yellow ovals with star - active Aurora B complex, teal ovals-phosphatase).

References

    1. Glotzer M. The molecular requirements for cytokinesis. Science. 2005;307:1735–1739. - PubMed
    1. Bement WM, Benink HA, von Dassow G. A microtubule-dependent zone of active RhoA during cleavage plane specification. J Cell Biol. 2005;170:91–101. - PMC - PubMed
    1. Kalab P, Pralle A, Isacoff EY, Heald R, Weis K. Analysis of a RanGTP-regulated gradient in mitotic somatic cells. Nature. 2006;440:697–701. *9- - PubMed
    1. Rappaport R. Cytokinesis in Animal Cells. Cambridge: Cambridge University Press; 1996.
    1. Alsop GB, Zhang D. Microtubules continuously dictate distribution of actin filaments and positioning of cell cleavage in grasshopper spermatocytes. J Cell Sci. 2004;117:1591–1602. - PubMed

Methods References

    1. Nguyen AW, Daugherty PS. Evolutionary optimization of fluorescent proteins for intracellular FRET. Nat Biotechnol. 2005;23:355–360. - PubMed
    1. Shelby RD, Hahn KM, Sullivan KF. Dynamic elastic behavior of alpha-satellite DNA domains visualized in situ in living human cells. J Cell Biol. 1996;135:545–557. - PMC - PubMed
    1. Peters U, et al. Probing cell-division phenotype space and Polo-like kinase function using small molecules. Nat Chem Biol. 2006;2:618–626. - PubMed

Publication types