. 2008 Feb 29;4(2):e1000012.
doi: 10.1371/journal.ppat.1000012.

Multiple reassortment events in the evolutionary history of H1N1 influenza A virus since 1918

Affiliations

Multiple reassortment events in the evolutionary history of H1N1 influenza A virus since 1918

Martha I Nelson et al. PLoS Pathog. .

Abstract

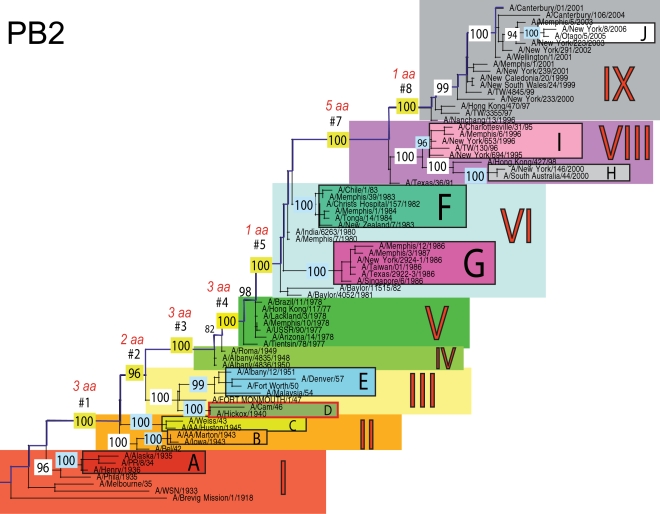
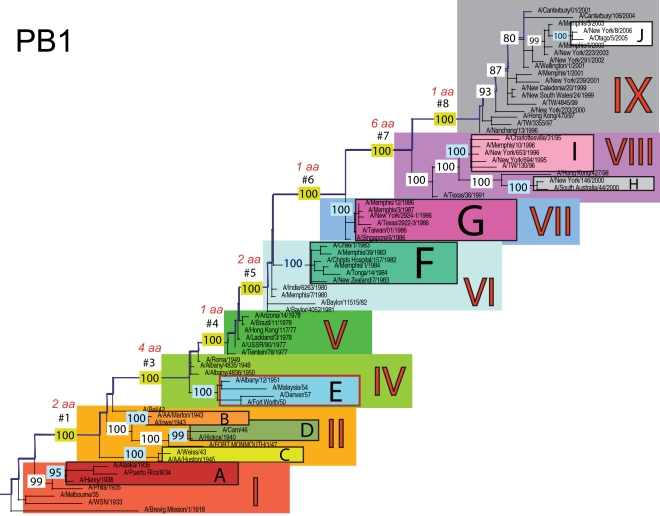
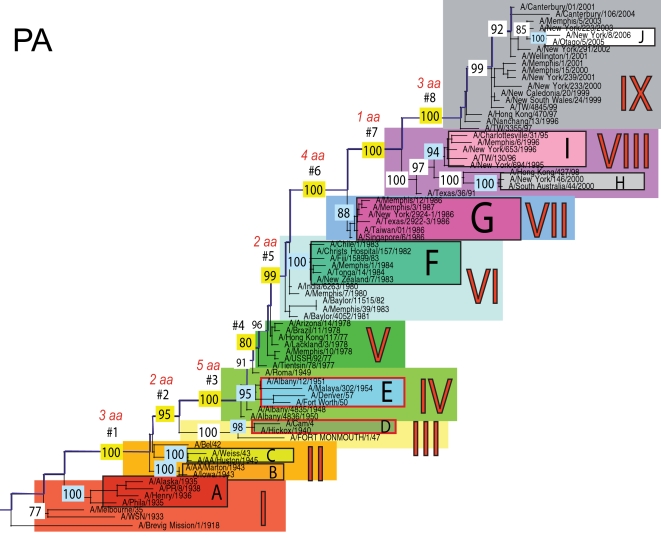
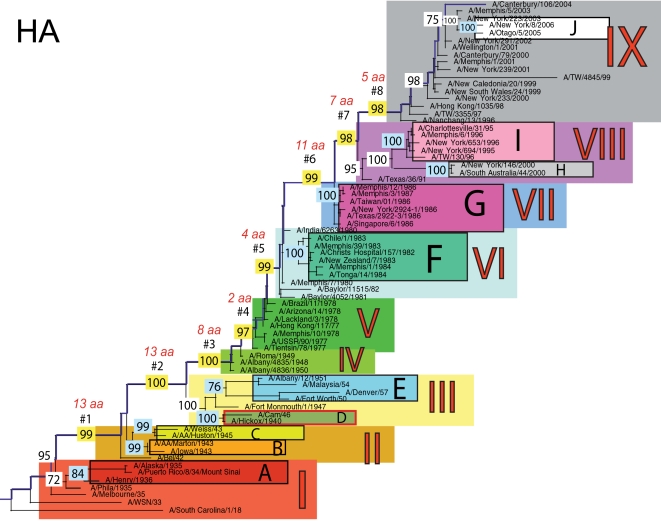
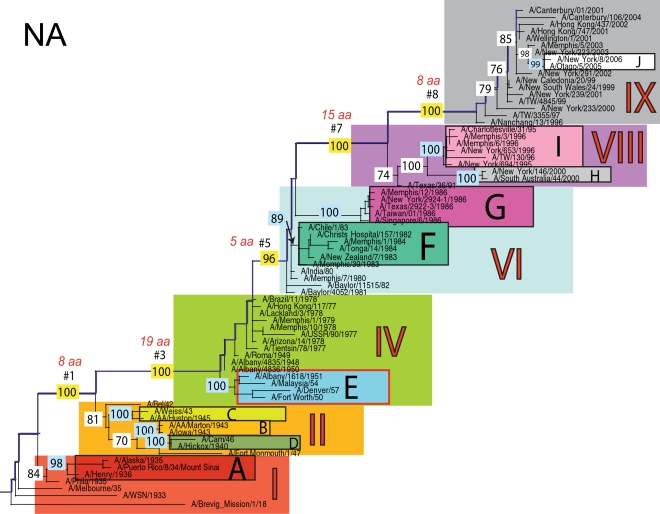
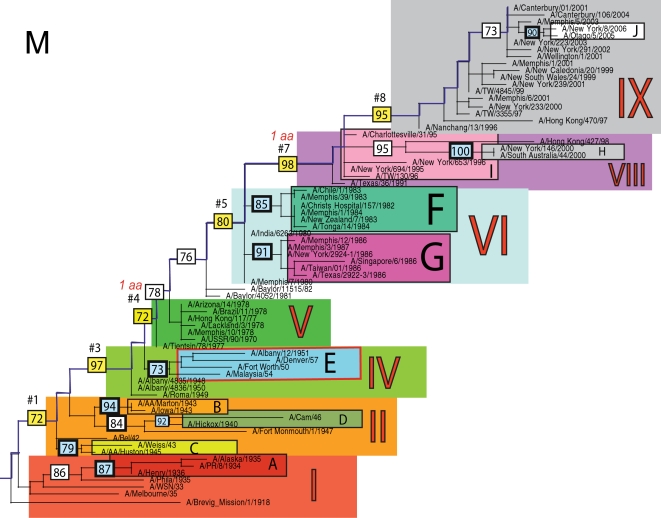
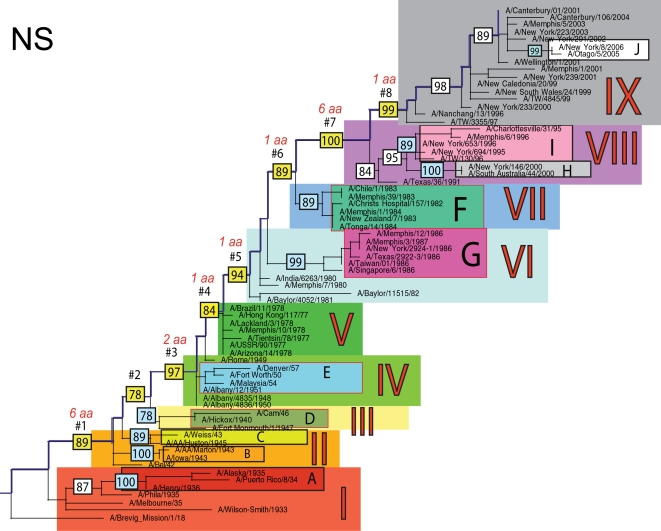
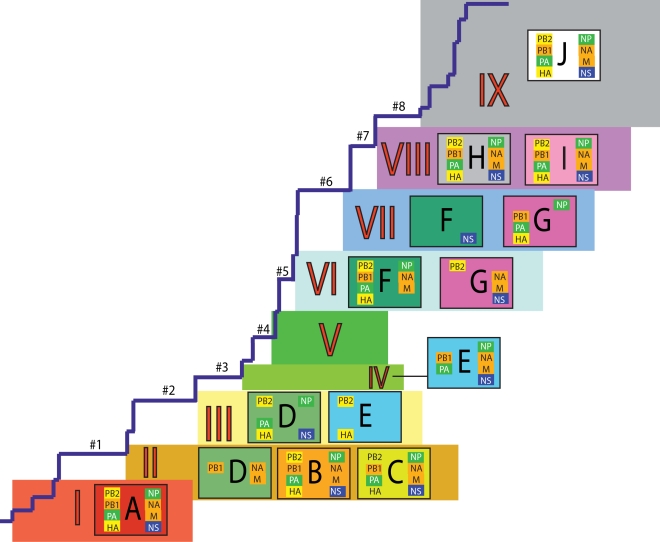
The H1N1 subtype of influenza A virus has caused substantial morbidity and mortality in humans, first documented in the global pandemic of 1918 and continuing to the present day. Despite this disease burden, the evolutionary history of the A/H1N1 virus is not well understood, particularly whether there is a virological basis for several notable epidemics of unusual severity in the 1940s and 1950s. Using a data set of 71 representative complete genome sequences sampled between 1918 and 2006, we show that segmental reassortment has played an important role in the genomic evolution of A/H1N1 since 1918. Specifically, we demonstrate that an A/H1N1 isolate from the 1947 epidemic acquired novel PB2 and HA genes through intra-subtype reassortment, which may explain the abrupt antigenic evolution of this virus. Similarly, the 1951 influenza epidemic may also have been associated with reassortant A/H1N1 viruses. Intra-subtype reassortment therefore appears to be a more important process in the evolution and epidemiology of H1N1 influenza A virus than previously realized.


Conflict of interest statement

The authors have declared that no competing interests exist.

Figures

Figure 1
Figure 1. Phylogenetic relationships of the PB2 gene of A/H1N1 influenza viruses (n = 71) sampled globally from 1918–2006, estimated using a maximal likelihood (ML) method.
All branch lengths are drawn to a scale of nucleotide substitutions per site. The tree is rooted using the oldest sequence, A/Brevig Mission/1/1918, and temporally ordered with the oldest isolates falling at the bottom left of the phylogeny and the newest isolates at the top right. Main phylogenetic sections that are separated by long trunk branches are numbered I–IX and colored as follows: section I is red, section II is orange, section III is yellow, section IV is light green, section V is dark green, section VI is light blue, section VII is absent due to the position of clade G within section VI (would otherwise be blue), section VIII is purple, and section IX is gray. The trunk branches separating these sections are labeled #1–#8 and highlighted in dark blue, with the bootstrap value supporting this branch highlighted in yellow and the number of amino acid changes that occur along each branch appearing above in red font. Ten main clades are labeled A–J, with supporting bootstrap values in light blue, and are colored as follows: clade A is dark red, clade B is orange, clade C is yellow, clade D is olive green, clade E is light blue, clade F is turquoise, clade G is fuchsia, clade H is gray, clade I is pink, and clade J is white. Clades that have undergone reassortment are outlined in red (in this case Clade D).
Figure 2
Figure 2. Phylogenetic relationships of the PB1 gene of A/H1N1 influenza viruses (n = 71) sampled globally from 1918–2006, estimated using ML.
Rooting, scale, and color scheme are the same as those used in Figure 1.
Figure 3
Figure 3. Phylogenetic relationships of the PA gene of A/H1N1 influenza viruses (n = 71) sampled globally from 1918–2006, estimated using ML.
Rooting, scale, and color scheme are the same as those used in Figure 1.
Figure 4
Figure 4. Phylogenetic relationships of the HA gene of A/H1N1 influenza viruses (n = 71) sampled globally from 1918–2006, estimated using ML.
Rooting, scale, and color scheme are the same as those used in Figure 1.
Figure 5
Figure 5. Phylogenetic relationships of the NP gene of A/H1N1 influenza viruses (n = 71) sampled globally from 1918–2006, estimated using ML.
Rooting, scale, and color scheme are the same as those used in Figure 1.
Figure 6
Figure 6. Phylogenetic relationships of the NA gene of A/H1N1 influenza viruses (n = 71) sampled globally from 1918–2006, estimated using ML.
Rooting, scale, and color scheme are the same as those used in Figure 1.
Figure 7
Figure 7. Phylogenetic relationships of the M1 gene of A/H1N1 influenza viruses (n = 71) sampled globally from 1918–2006, estimated using ML.
Rooting, scale, and color scheme are the same as those used in Figure 1.
Figure 8
Figure 8. Phylogenetic relationships of the NS1 gene of A/H1N1 influenza viruses (n = 71) sampled globally from 1918–2006, estimated using ML.
Rooting, scale, and color scheme are the same as those used in Figure 1.
Figure 9
Figure 9. Schematic representation of the phylogenetic patterns of all eight A/H1N1 influenza virus genomes used in this study (Figures 1– 8).
The main trunk (back-bone) lineage is taken from the HA phylogeny, with the nine sections I–IX and long trunk braches #1–8 corresponding to their respective positions on HA phylogeny and similarly color-coded. Clades A–J are also color-coded as in Figures 1– 8. Each clade is positioned within a given phylogenetic section for all viral genome segments contained within the box. Viral genome segments are color-coded to show similarities in the phylogenetic patterns between multiple segments: PB2 and HA follow similar phylogenetic patterns and are colored in yellow boxes; PB1, NA, and M are phylogenetically similar and are shaded in orange boxes; PA and NP are in green boxes; NS follows a pattern unique to itself and is alone colored in a dark purple box.

References

    1. Johnson NP, Mueller J. Updating the accounts: global mortality of the 1918–1920 “Spanish” influenza pandemic. Bull Hist Med. 2002;56:105–115. - PubMed
    1. Taubenberger JK, Morens DM. 1918 influenza: the mother of all pandemics. Emerg Infect Dis. 2006;12:15–22. - PMC - PubMed
    1. Kilbourne ED. Influenza pandemics of the 20th century. Emerg Infect Dis. 2006;12:9–14. - PMC - PubMed
    1. Logan WP, MacKay DG. Development of influenza epidemics. Lancet. 1951;260:284–285. - PubMed
    1. Taubenberger JK, Reid AH, Janczewski TA, Fanning TG. Integrating historical, clinical and molecular data in order to explain the origin and virulence of the 1918 Spanish influenza virus. Phil Trans R Soc Lond B. 2001;356:1829–1839. - PMC - PubMed

Publication types