

Review
doi: 10.1371/journal.pcbi.0040006.
Comprehensive analysis of affymetrix exon arrays using BioConductor
Affiliations
- PMID: 18463711
- PMCID: PMC2323405
- DOI: 10.1371/journal.pcbi.0040006
Item in Clipboard
Review
Comprehensive analysis of affymetrix exon arrays using BioConductor
PLoS Comput Biol.
2008 Feb.
No abstract available
Conflict of interest statement
Figures
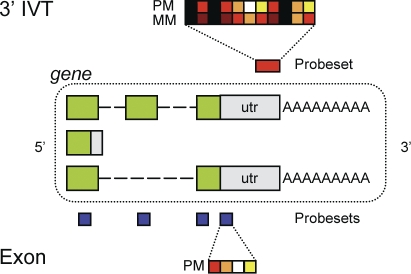
On standard 3′IVT, arrays such as the HGU133plus2 chip, each gene is typically targeted by a single probeset placed at the 3′ end of the transcript. These probesets consist of 11 Perfect Match spots and 11 paired Mis-Match spots in which the middle residue has been changed. Exon arrays have probesets placed against each exon along the length of the gene. Exon array probesets have no paired Mis-Match spots and four probes per probeset.
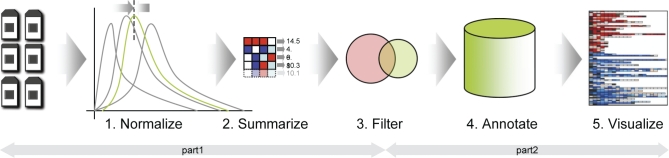
A standard pipeline for array processing involves 1. normalizing the arrays, 2. generating expression summaries, 3. filtering on correlation, fold-change, and/or statistical significance to select interesting probesets, 4. mapping those probesets to their target transcripts by annotation, and 5. visualization and downstream analysis.
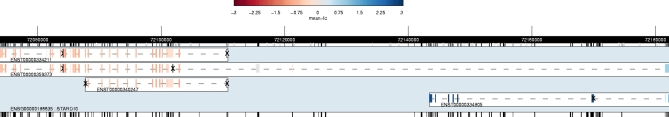
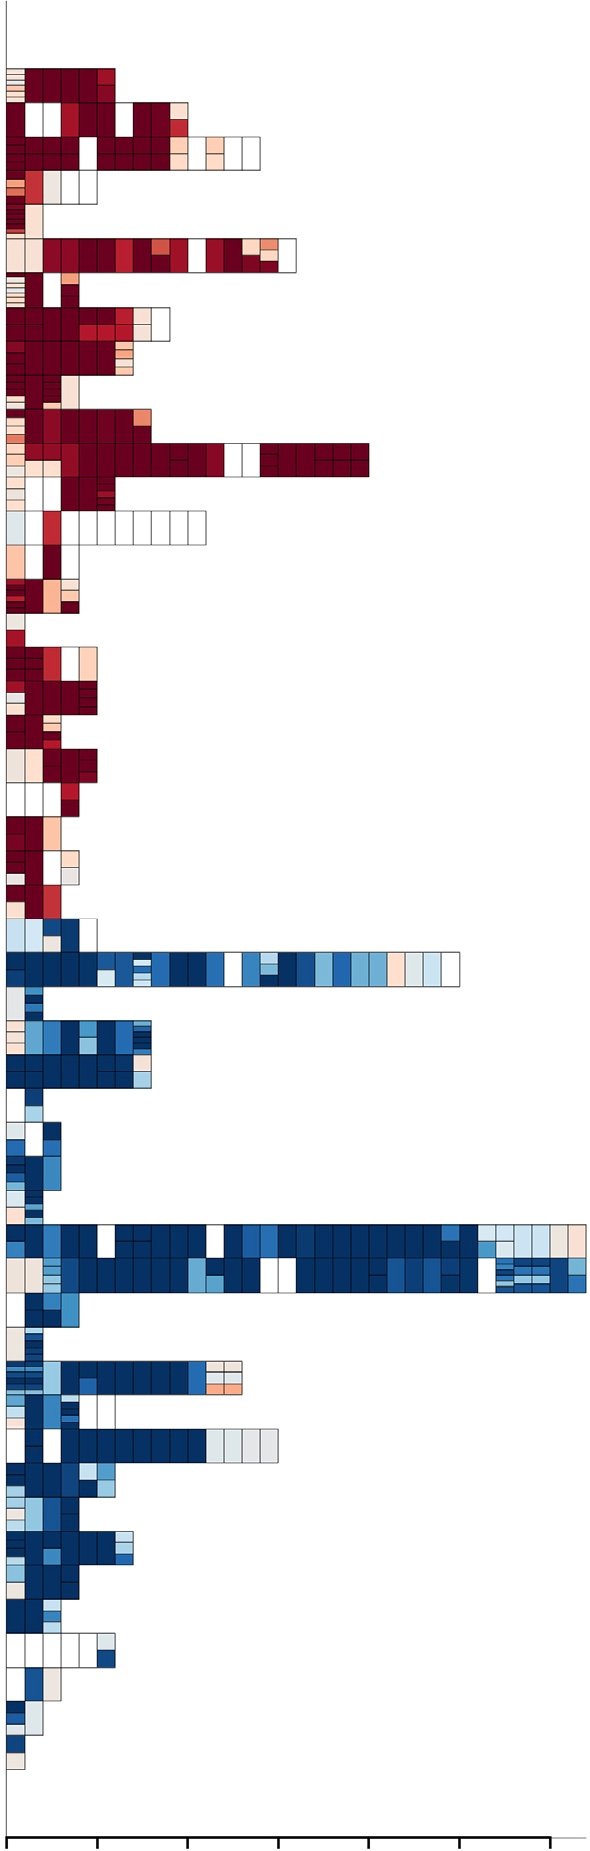
Each row corresponds to a gene, each rectangle to an exon. Exons are arranged in sequence order. If an exon is targeted by multiple probesets, these are stacked vertically within that exon. The plot is coloured by fold change between MCF7 and MCF10A (red, up in MCF7; blue, up in MCF10A).
Similar articles
-
FIRMA: a method for detection of alternative splicing from exon array data.Bioinformatics. 2008 Aug 1;24(15):1707-14. doi: 10.1093/bioinformatics/btn284. Epub 2008 Jun 23. Bioinformatics. 2008. PMID: 18573797 Free PMC article.
-
Splicy: a web-based tool for the prediction of possible alternative splicing events from Affymetrix probeset data.BMC Bioinformatics. 2007 Mar 8;8 Suppl 1(Suppl 1):S17. doi: 10.1186/1471-2105-8-S1-S17. BMC Bioinformatics. 2007. PMID: 17430561 Free PMC article.
-
ARH: predicting splice variants from genome-wide data with modified entropy.Bioinformatics. 2010 Jan 1;26(1):84-90. doi: 10.1093/bioinformatics/btp626. Epub 2009 Nov 4. Bioinformatics. 2010. PMID: 19889797
-
ASTALAVISTA: dynamic and flexible analysis of alternative splicing events in custom gene datasets.Nucleic Acids Res. 2007 Jul;35(Web Server issue):W297-9. doi: 10.1093/nar/gkm311. Epub 2007 May 7. Nucleic Acids Res. 2007. PMID: 17485470 Free PMC article.
-
Microarrays in cancer: research and applications.Biotechniques. 2003 Mar;Suppl:4-15. Biotechniques. 2003. PMID: 12664679 Review. No abstract available.
Cited by
-
Multidimensional gene set analysis of genomic data.PLoS One. 2010 Apr 27;5(4):e10348. doi: 10.1371/journal.pone.0010348. PLoS One. 2010. PMID: 20436964 Free PMC article.
-
Overestimation of alternative splicing caused by variable probe characteristics in exon arrays.Nucleic Acids Res. 2009 Sep;37(16):e107. doi: 10.1093/nar/gkp508. Epub 2009 Jun 15. Nucleic Acids Res. 2009. PMID: 19528075 Free PMC article.
-
Evaluation of microarray preprocessing algorithms based on concordance with RT-PCR in clinical samples.PLoS One. 2009 May 21;4(5):e5645. doi: 10.1371/journal.pone.0005645. PLoS One. 2009. PMID: 19461970 Free PMC article.
-
Gene expression and isoform variation analysis using Affymetrix Exon Arrays.BMC Genomics. 2008 Nov 7;9:529. doi: 10.1186/1471-2164-9-529. BMC Genomics. 2008. PMID: 18990248 Free PMC article.
-
rnaSeqMap: a Bioconductor package for RNA sequencing data exploration.BMC Bioinformatics. 2011 May 25;12:200. doi: 10.1186/1471-2105-12-200. BMC Bioinformatics. 2011. PMID: 21612622 Free PMC article.
References
-
- Gentleman R, Carey V, Huber W, Irizarry R, Dudoit S. Bioinformatics and computational biology solutions using R and Bioconductor. New York: Springer; 2005.
-
- Venables WN, Ripley BD. S programming. New York: Springer; 2000.
-
- R-Development-core-team. The R Manuals. Available: http://cran.r-project.org/manuals.html. Accessed 10 December 2007.
-
- Modrek B, Lee C. A genomic view of alternative splicing. Nat Genet. 2002;30:13–19. - PubMed
Publication types
MeSH terms
Substances
Grants and funding
LinkOut - more resources
Full Text Sources
