

The impact of recombination on nucleotide substitutions in the human genome
- PMID: 18464896
- PMCID: PMC2346554
- DOI: 10.1371/journal.pgen.1000071
The impact of recombination on nucleotide substitutions in the human genome
Abstract
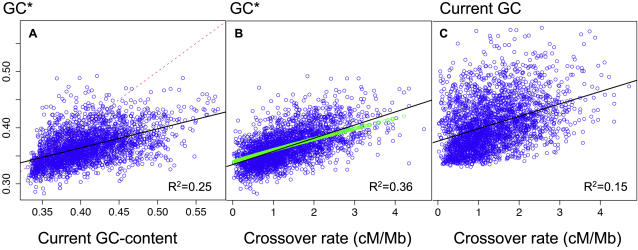
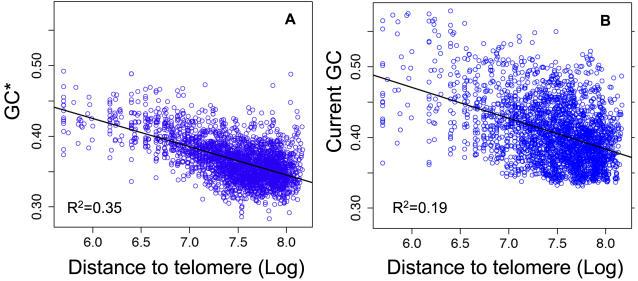
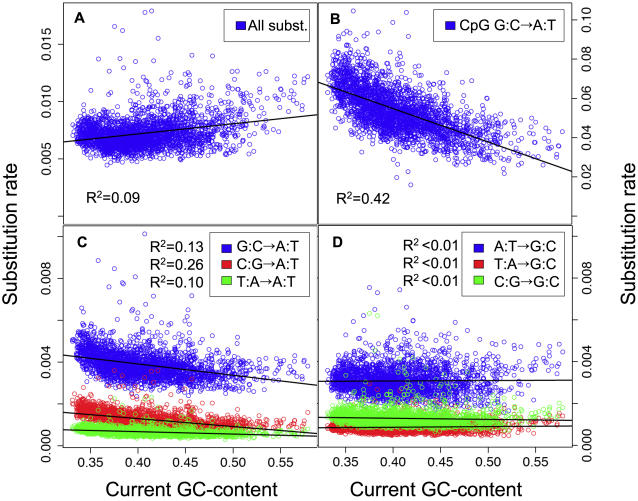
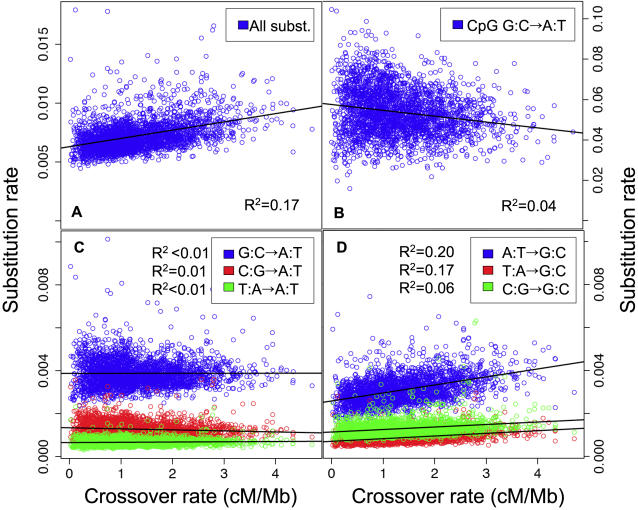
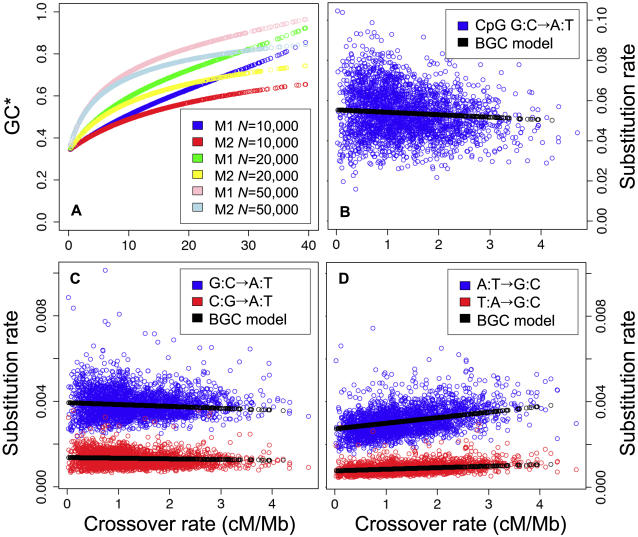
Unraveling the evolutionary forces responsible for variations of neutral substitution patterns among taxa or along genomes is a major issue for detecting selection within sequences. Mammalian genomes show large-scale regional variations of GC-content (the isochores), but the substitution processes at the origin of this structure are poorly understood. We analyzed the pattern of neutral substitutions in 1 Gb of primate non-coding regions. We show that the GC-content toward which sequences are evolving is strongly negatively correlated to the distance to telomeres and positively correlated to the rate of crossovers (R2 = 47%). This demonstrates that recombination has a major impact on substitution patterns in human, driving the evolution of GC-content. The evolution of GC-content correlates much more strongly with male than with female crossover rate, which rules out selectionist models for the evolution of isochores. This effect of recombination is most probably a consequence of the neutral process of biased gene conversion (BGC) occurring within recombination hotspots. We show that the predictions of this model fit very well with the observed substitution patterns in the human genome. This model notably explains the positive correlation between substitution rate and recombination rate. Theoretical calculations indicate that variations in population size or density in recombination hotspots can have a very strong impact on the evolution of base composition. Furthermore, recombination hotspots can create strong substitution hotspots. This molecular drive affects both coding and non-coding regions. We therefore conclude that along with mutation, selection and drift, BGC is one of the major factors driving genome evolution. Our results also shed light on variations in the rate of crossover relative to non-crossover events, along chromosomes and according to sex, and also on the conservation of hotspot density between human and chimp.
Conflict of interest statement
The authors have declared that no competing interests exist.
Figures
References
-
- Eyre-walker A, Hurst LD. The evolution of isochores. Nat Rev Genet. 2001;2:549–555. - PubMed
-
- Filipski J, Thiery JP, Bernardi G. An analysis of the bovine genome by Cs2SO4-Ag density gradient centrifugation. J Mol Biol. 1973;80:177–197. - PubMed
-
- Bernardi G. The vertebrate genome: isochores and evolution. Mol Biol Evol. 1993;10:186–204. - PubMed
-
- Lercher MJ, Urrutia AO, Pavlicek A, Hurst LD. A unification of mosaic structures in the human genome. Hum Mol Genet. 2003;12:2411–2415. - PubMed
Publication types
MeSH terms
Substances
LinkOut - more resources
Full Text Sources
Miscellaneous
