. 2008 Jun;118(6):2246-59.
doi: 10.1172/JCI33578.

Mechanisms of cardiac arrhythmias and sudden death in transgenic rabbits with long QT syndrome

Affiliations

Mechanisms of cardiac arrhythmias and sudden death in transgenic rabbits with long QT syndrome

Michael Brunner et al. J Clin Invest. 2008 Jun.

Abstract

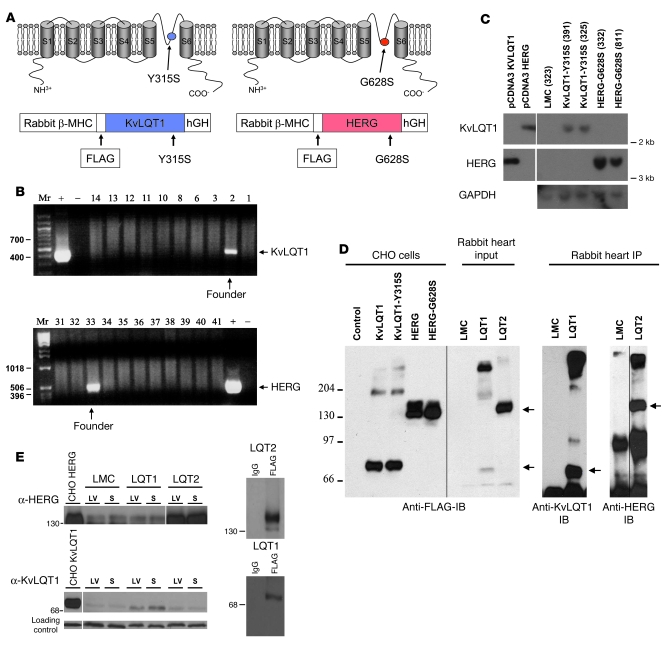
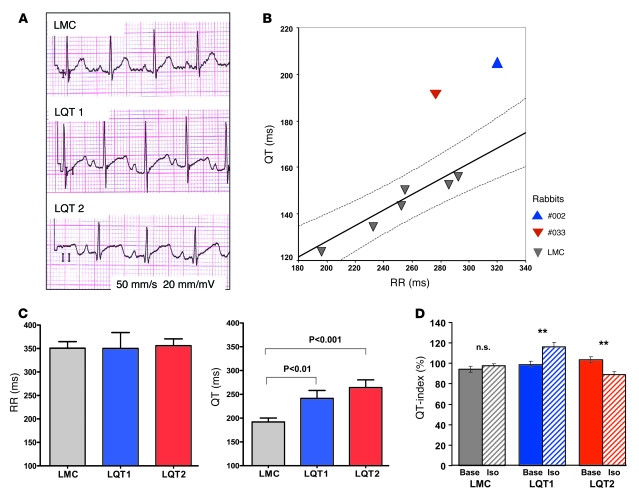
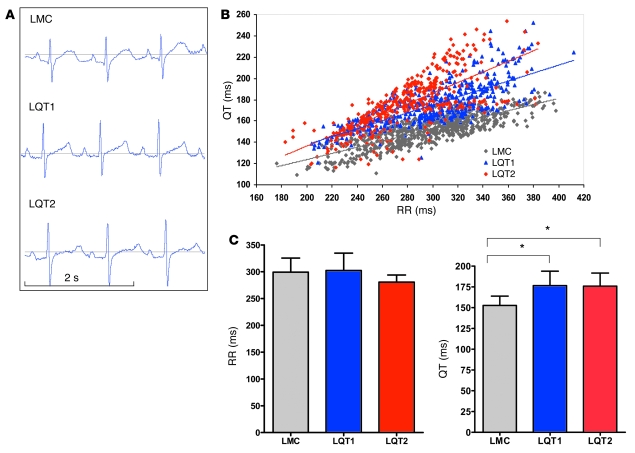
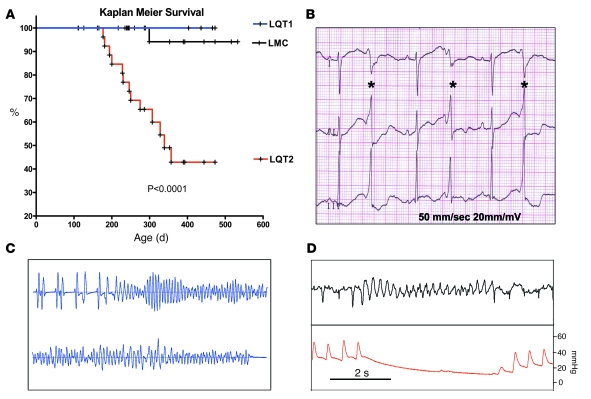
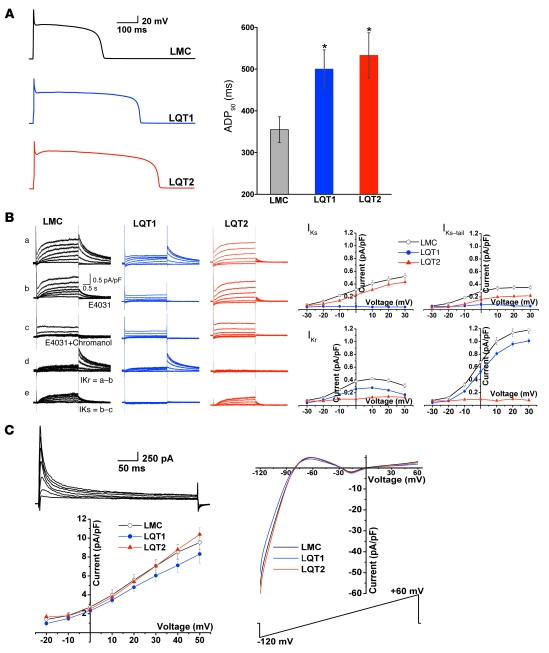
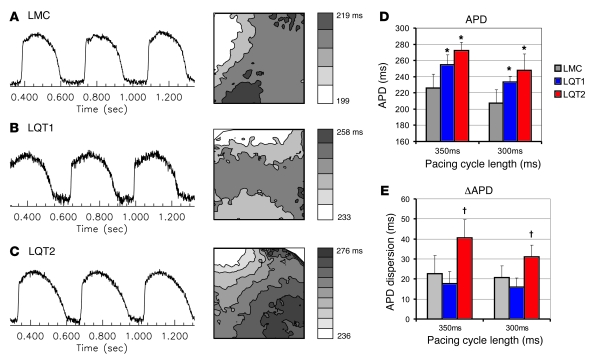
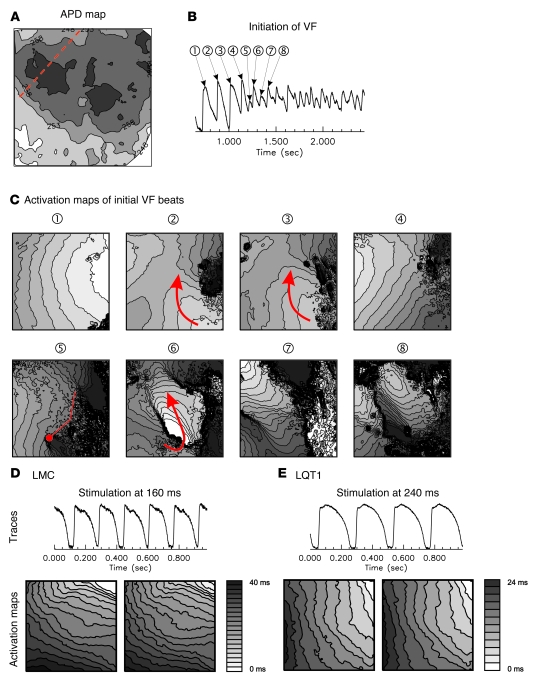
Long QT syndrome (LQTS) is a heritable disease associated with ECG QT interval prolongation, ventricular tachycardia, and sudden cardiac death in young patients. Among genotyped individuals, mutations in genes encoding repolarizing K+ channels (LQT1:KCNQ1; LQT2:KCNH2) are present in approximately 90% of affected individuals. Expression of pore mutants of the human genes KCNQ1 (KvLQT1-Y315S) and KCNH2 (HERG-G628S) in the rabbit heart produced transgenic rabbits with a long QT phenotype. Prolongations of QT intervals and action potential durations were due to the elimination of IKs and IKr currents in cardiomyocytes. LQT2 rabbits showed a high incidence of spontaneous sudden cardiac death (>50% at 1 year) due to polymorphic ventricular tachycardia. Optical mapping revealed increased spatial dispersion of repolarization underlying the arrhythmias. Both transgenes caused downregulation of the remaining complementary IKr and IKs without affecting the steady state levels of the native polypeptides. Thus, the elimination of 1 repolarizing current was associated with downregulation of the reciprocal repolarizing current rather than with the compensatory upregulation observed previously in LQTS mouse models. This suggests that mutant KvLQT1 and HERG interacted with the reciprocal wild-type alpha subunits of rabbit ERG and KvLQT1, respectively. These results have implications for understanding the nature and heterogeneity of cardiac arrhythmias and sudden cardiac death.


Figures

Figure 1
Figure 1. Transgenic constructs and expression studies.
(A) Schematic drawings of the mutations (top) in KvLQT1 (left) and HERG (right) polypeptides and transgenic constructs (bottom). (B) PCR of genomic DNA of the founders: + and – denote positive control (constructs) and negative control. Numbers correspond to animals. Rabbits 2 (for KvLQT1) and 33 (HERG) tested positive. (C) Southern blot analyses of genomic DNA. Numbers in brackets indicate rabbit numbers. The sizes of the inserts incorporated into the rabbit genome (right panel) were identical to those of the plasmids (left panel). (D) Left panel shows Western blots of membrane lysates of CHO cells transfected with empty vector (control), KvLQT1, KvLQT1-Y315S, HERG, and HERG-G628S, and heart lysates from LMC, LQT1, and LQT2. Right panels show IP with anti-FLAG antibody of LMC, LQT1 (KvLQT1-Y315S), and LQT2 (HERG-G628S) crude heart lysates probed with anti-HERG and anti-KvLQT1 antibodies, respectively. The apparent molecular weight is 75 kDa for KvLQT1 and 135 kDa and 155 kDa for HERG. (E) Crude heart membranes were prepared from sections (LV and septum [S]) of LMC, LQT1, and LQT2. 200 μg samples were immunoblotted with polyclonal HERG antibody (top) and monoclonal KvLQT1 antibody (bottom). Crude membranes from CHO cells transfected with HERG and KvLQT1 cDNA served as positive controls. Anti-HERG antibody reacted with a 155-kDa polypeptide representing the endogenous RERG expression in LMC and LQT1 hearts. The anti-KVLQT1 mAb detected a 75-kDa band representing the endogenous rabbit KvLQT1 channel polypeptides in LMC and LQT2 hearts. Upper right panel shows crude membranes from LQT2 or LQT1 rabbit hearts, which were reacted with either anti-FLAG mAb (right lane) or mouse IgG (left lane). Anti-HERG antibody detected a 155-kDa polypeptide, while IgG failed to precipitate this peptide. Lower right panel shows anti-KvLQT1 mAb, which reacted with a 75-kDa band while IgG failed to precipitate it.
Figure 2
Figure 2. Phenotypic characterization in sedated animals.
(A) Sample ECGs (lead II) of the founders and an LMC rabbit with midazolam sedation (2 mg/kg, i.m.). Note the markedly prolonged QT interval and the lack of an isoelectric T-P line in both transgenic rabbits. (B) QT/RR relationship (mean of all 12 leads per animal) under midazolam sedation in the 2 founder rabbits and 6 LMCs. Dotted lines denote the 95% confidence intervals of the linear regression derived from the LMCs. (C) RR and QT intervals (mean of 12-lead surface ECG per animal) in ketamine/xylazine-sedated male rabbits (n = 13 LMC, 9 LQT1, and 10 LQT2 animals). (D) Effect of isoproterenol on QT index in isoflurane-sedated LMC, LQT1, and LQT2 rabbits. Solid bars denote baseline (base); hatched bars denote isoproterenol (Iso). **P < 0.01.
Figure 3
Figure 3. Phenotypic characterization in awake, free-moving animals.
(A) Sample telemetric ECGs (lead II) of awake, free-moving male rabbits. (B) QT/RR relationship in awake, free-moving rabbits recorded approximately every 20 minutes for 24 hours in 11 LMC, 8 LQT1, and 6 LQT2 male rabbits. Lines indicate linear regression derived from the mean of all individual regression lines per genotype. (C) RR and QT intervals (mean of 72 telemetric measurements/animal during 24-hour monitoring) of awake, free-moving male rabbits. *P < 0.05.
Figure 4
Figure 4. Histology of transgenic and LMC animals.
Sample H&E-stained histological sections of the middle of the LV free wall. Left panels, LMC; middle panels, LQT1 rabbit; right panels, LQT2 rabbit. Original magnification, ×10 (top panels); ×20 (middle panels); ×40 (bottom panels). Scale bars: 10 μm. Boxes in the top row indicate areas of further magnification shown in the middle and bottom rows.
Figure 5
Figure 5. Sudden death and spontaneous arrhythmias.
(A) Kaplan-Meier survival curve of 51 LMC, 26 LQT1, and 34 LQT2 rabbits. (B) Sample ventricular extrasystoles (bigeminy) with R-on-T phenomenon in the LQT2 founder rabbit during ECG (leads I, II, III) recording with midazolam sedation. Asterisks denote ventricular extrasystoles. This rabbit died suddenly approximately 2 weeks after this recording. (C) Telemetric recording of a polymorphic VT leading to the death of a LQT2 rabbit. The torsade is initiated by repetitive short-long-short sequences due to ventricular extrasystoles. (D) Spontaneous polymorphic tachycardia in a ketamine/xylazine-anesthetized rabbit. Top panel shows ECG lead II. Bottom panel shows simultaneous arterial pressure recorded from the ear artery.
Figure 6
Figure 6. Cellular electrophysiology.
(A) APD of rabbit ventricular myocytes. Left panel shows typical action potential recordings (0.1 Hz) from LMC, LQT1, and LQT2 rabbits. Right shows averaged APD (APD90, mean ± SEM) of LMC (354.05 ± 30.07 ms, n = 22), LQT1 (499.88 ± 45.71 ms, n = 14), and LQT2 rabbits (533.14 ± 54.22 ms, n = 14); *P < 0.05. (B) Isolation and quantification of IKr and IKs. Left panel shows original recordings of control, LQT1, and LQT2 rabbits as indicated. After a recording without drugs (a), the cells were perfused with 5 μM E-4031 (b) and IKr was defined as the E4031-sensitive current (d). Secondary to E4031 application, the cells were further perfused with 30 μM chromanol 293B (c) and IKs was defined as chromanol-sensitive current (e). Right panels shows quantification of IKr and IKs. Current amplitudes measured at the end of repolarization (IKs or IKr) and the peak of the tail (IKs tail or IKr tail) were plotted against membrane voltages. All currents were normalized to cell capacitance. Open circles depict control myocytes (n = 20 from 6 rabbits), filled circles depict LQT1 myocytes (n = 17 from 5 rabbits), and filled triangles depict LQT2 myocytes (n = 12 from 3 rabbits). The downregulation of IKr (in LQT1) or IKs (in LQT2) was significant compared with controls (P < 0.05 by 2-way ANOVA). (C) Ito current and IK1 currents. Standard current-voltage relationship (IV curve) of Ito (left panel) or quasi-IV curve of IK1 (right panel) revealed no significant differences in peak Ito currents (n = 6–8) or IK1 currents (right, n = 10–12) among LMC, LQT1, and LQT2 rabbits.
Figure 7
Figure 7. APD and APD dispersion in transgenic rabbits.
(AC) Typical raw data of action potential traces are shown in the left columns. APDs were measured as described in Methods and mapped in each group. Isochronal lines were drawn every 5 ms with lighter color representing shorter APD. (D) Mean APD in each group at basic cycle length of 350 and 300 ms. LMC (n = 6), LQT1 (n = 3), and LQT2 rabbits (n = 4). LQT2 and LQT1 rabbits show statistically significant differences in APD compared with LMC; *P < 0.05. (E) APD dispersion. APD dispersion was calculated by differences between APDmax and APDmin. LQT2 rabbits show greater dispersion compared with LMC. P < 0.05.
Figure 8
Figure 8. Activation maps of VF initiation in an LQT2 heart.
(A) APD map. The red dotted line marks the interventricular septum. The APD map in LQT2 shows increased dispersion, mostly in the mid LV region. (B) Trace of action potentials during initial period of VF. (C) Series of activation maps marked in panel B. Isochronal lines are drawn every 2-ms interval, and lighter color represents earlier activation. Panel no. 1 shows activation pattern of the paced beat. The following beats (nos. 2 and 3) encounter conduction block where the APD is longer (see panel A). Therefore, the LV activated via the apical free wall where APD is shorter and tissue is recovered from the previous beat. The next activation (no. 4) appears from the RV and propagates toward the mid LV. A similar wave front (no. 5) encounters conduction block (red straight line) in the region where APD is longer and forms a rotation (no. 6), initiating VF (no. 7 and no. 8). This initiation highlights APD dispersion as an important mechanism in arrhythmia formation in this LQT2 model. (D and E) Traces and activation maps from LMC and LQT1 hearts. Traces and maps were taken at the shortest cycle length that did not cause 2:1 block. Both LMC and LQT1 showed uninterrupted conduction from the stimulation sites to the rest of the heart without rotation or conduction blocks.

References

    1. Moss A.J. Long QT syndrome. JAMA. 2003;289:2041–2044. doi: 10.1001/jama.289.16.2041. - DOI - PubMed
    1. Priori S.G., Bloise R., Crotti L. The long QT syndrome. Europace. 2001;3:16–27. doi: 10.1053/eupc.2000.0141. - DOI - PubMed
    1. Roden D.M. Long-QT syndrome. N. Engl. J. Med. 2008;358:169–176. doi: 10.1056/NEJMcp0706513. - DOI - PubMed
    1. Curran M.E., et al. A molecular basis for cardiac arrhythmia: HERG mutations cause long QT syndrome. Cell. 1995;80:795–803. doi: 10.1016/0092-8674(95)90358-5. - DOI - PubMed
    1. Sanguinetti M.C., Curran M.E., Spector P.S., Keating M.T. Spectrum of HERG K+-channel dysfunction in an inherited cardiac arrhythmia. Proc. Natl. Acad. Sci. U. S. A. 1996;93:2208–2212. doi: 10.1073/pnas.93.5.2208. - DOI - PMC - PubMed

Publication types

Substances