

Effects of aging on cerebral blood flow, oxygen metabolism, and blood oxygenation level dependent responses to visual stimulation
- PMID: 18465743
- PMCID: PMC2810490
- DOI: 10.1002/hbm.20574
Effects of aging on cerebral blood flow, oxygen metabolism, and blood oxygenation level dependent responses to visual stimulation
Abstract
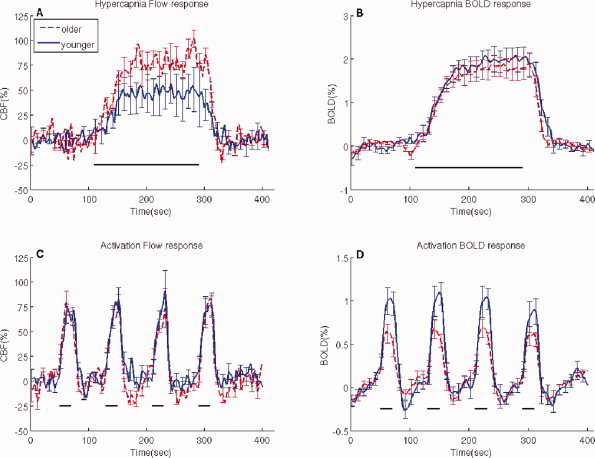
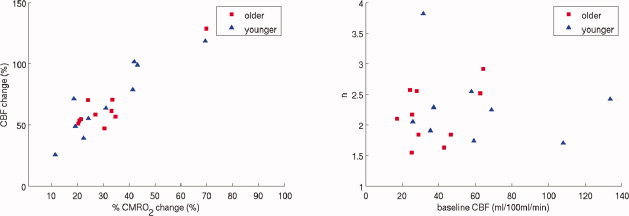
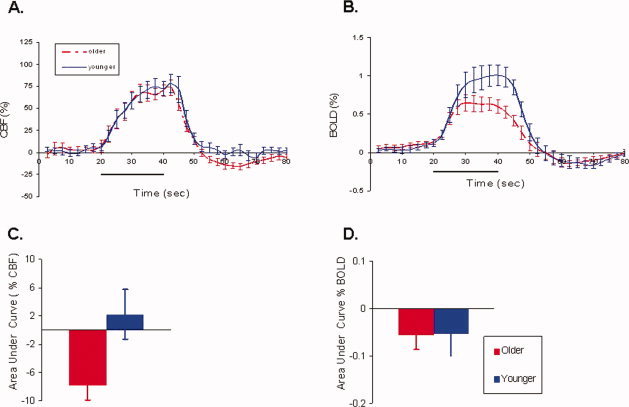
Calibrated functional magnetic resonance imaging (fMRI) provides a noninvasive technique to assess functional metabolic changes associated with normal aging. We simultaneously measured both the magnitude of the blood oxygenation level dependent (BOLD) and cerebral blood flow (CBF) responses in the visual cortex for separate conditions of mild hypercapnia (5% CO(2)) and a simple checkerboard stimulus in healthy younger (n = 10, mean: 28-years-old) and older (n = 10, mean: 53-years-old) adults. From these data we derived baseline CBF, the BOLD scaling parameter M, the fractional change in the cerebral metabolic rate of oxygen consumption (CMRO(2)) with activation, and the coupling ratio n of the fractional changes in CBF and CMRO(2). For the functional activation paradigm, the magnitude of the BOLD response was significantly lower for the older group (0.57 +/- 0.07%) compared to the younger group (0.95 +/- 0.14%), despite the finding that the fractional CBF and CMRO(2) changes were similar for both groups. The weaker BOLD response for the older group was due to a reduction in the parameter M, which was significantly lower for older (4.6 +/- 0.4%) than younger subjects (6.5 +/- 0.8%), most likely reflecting a reduction in baseline CBF for older (41.7 +/- 4.8 mL/100 mL/min) compared to younger (59.6 +/- 9.1 mL/100 mL/min) subjects. In addition to these primary responses, for both groups the BOLD response exhibited a post-stimulus undershoot with no significant difference in this magnitude. However, the post-undershoot period of the CBF response was significantly greater for older compared to younger subjects. We conclude that when comparing two populations, the BOLD response can provide misleading reflections of underlying physiological changes. A calibrated approach provides a more quantitative reflection of underlying metabolic changes than the BOLD response alone.
2008 Wiley-Liss, Inc.
Figures
References
-
- Adachi‐Usami E,Hosoda L,Toyonaga N ( 1988): Effects of aging on the temporal frequency characteristics determined by pattern visually evoked cortical potentials. Doc Ophthalmol 69: 139–144. - PubMed
-
- Aizenstein HJ,Clark KA,Butters MA,Cochran J,Stenger VA,Meltzer CC,Reynolds CF,Carter CS ( 2004): The BOLD hemodynamic response in healthy aging. J Cogn Neurosci 16: 786–793. - PubMed
-
- Allison T,Hume AL,Wood CC,Goff WR ( 1984): Developmental and aging changes in somatosensory, auditory and visual evoked potentials. Electroencephalogr Clin Neurophysiol 58: 14–24. - PubMed
-
- Bandettini PA,Wong EC ( 1997): A hypercapnia‐based normalization method for improved spatial localization of the human brain activation with fMRI. NMR Biomed 10: 197–203. - PubMed
Publication types
MeSH terms
Substances
Grants and funding
LinkOut - more resources
Full Text Sources
Medical
