. 2009 Mar;30(3):998-1013.
doi: 10.1002/hbm.20567.

Cortical sources of visual evoked potentials during consciousness of executive processes

Affiliations

Cortical sources of visual evoked potentials during consciousness of executive processes

Claudio Babiloni et al. Hum Brain Mapp. 2009 Mar.

Abstract

What is the timing of cortical activation related to consciousness of visuo-spatial executive functions? Electroencephalographic data (128 channels) were recorded in 13 adults. Cue stimulus briefly appeared on right or left (equal probability) monitor side for a period, inducing about 50% of recognitions. It was then masked and followed (2 s) by a central visual go stimulus. Left (right) mouse button had to be clicked after right (left) cue stimulus. This "inverted" response indexed executive processes. Afterward, subjects said "seen" if they had detected the cue stimulus or "not seen" when it was missed. Sources of event-related potentials (ERPs) were estimated by LORETA software. The inverted responses were about 95% in seen trials and about 60% in not seen trials. Cue stimulus evoked frontal-parietooccipital potentials, having the same peak latencies in the seen and not seen data. Maximal difference in amplitude of the seen and not seen ERPs was detected at about +300-ms post-stimulus (P3). P3 sources were higher in amplitude in the seen than not seen trials in dorsolateral prefrontal, premotor and parietooccipital areas. This was true in dorsolateral prefrontal and premotor cortex even when percentage of the inverted responses and reaction time were paired in the seen and not seen trials. These results suggest that, in normal subjects, the primary consciousness enhances the efficacy of visuo-spatial executive processes and is sub-served by a late (100- to 400-ms post-stimulus) enhancement of the neural synchronization in frontal areas.


Figures
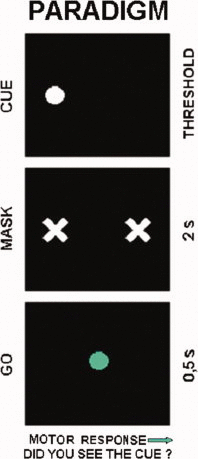
Figure 1
Figure 1
The sequence of events during a trial was: (i) cue stimulus appearing on the right or left monitor side for the threshold time giving about 50% of stimulus recognition; (ii) masking stimulus lasting about 2 s (i.e. 2 s minus the threshold time); (iii) go stimulus lasting about 0.5 s. The go stimulus was a green circle with a diameter of about 0.5°, which appeared at the center of the monitor. A masking stimulus lasting 5.5 s was delivered between go and subsequent cue stimulus. Subjects had to click the left mouse button if the cue stimulus appeared on the right monitor side, whereas they had to click the right mouse button if the cue stimulus appeared on the left monitor side (inverted response). The computer receiving mouse inputs registered the corresponding reaction time and the side of the mouse button clicked. After hand motor response, subjects had to say seen if they had detected the cue stimulus (seen trial) or not seen if they had missed the cue stimulus (not seen trial). [Color figure can be viewed in the online issue, which is available at www.interscience.wiley.com.]
Figure 2
Figure 2
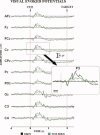
Grand average (N = 12) waveforms of event‐related potentials (ERPs) recorded at representative midline electrodes (AFz, Fz, FCz, Cz, CPz, Pz, POz, Oz, C3 and C4 sites of 10–20 system). These potentials were obtained averaging separately not seen, and seen trials. [Color figure can be viewed in the online issue, which is available at www.interscience.wiley.com.]
Figure 3
Figure 3
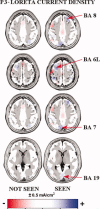
Grand average of LORETA solutions (i.e., current density at cortical voxels) modeling the distributed sources for P3 component of the ERPs. These solutions refer to the ERPs formed by seen and not seen trials (N = 12). [Color figure can be viewed in the online issue, which is available at www.interscience.wiley.com.]
Figure 4
Figure 4
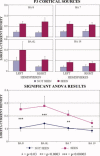
Top: Grand means (±SE) (N = 12) of LORETA P3 solutions for the factors condition (not seen and seen), hemisphere (right and left), and lobe of interest (prefrontal BA 8, premotor BA 6, posterior parietal BA 7, occipital BA 19). Bottom: grand means (± SE) of not seen and seen LORETA solutions, which represented significant interaction between the factors condition and lobe of interest. P3 source strength was used as dependent variable. The ANOVA analysis included factors such as condition, hemisphere, and lobe of interest. Duncan post hoc testing indicated that LORETA solutions were stronger in amplitude in seen than not seen P3 sources (P < 0.001). [Color figure can be viewed in the online issue, which is available at www.interscience.wiley.com.]
Figure 5
Figure 5
For each individual subject (N = 12), the same percentage of trials with inverted responses was averaged to form both seen and not seen ERPs. Furthermore, the EEG trials were selected to have practically equal mean reaction time in the seen and not seen trials. Grand average waveforms of event‐related potentials (ERPs) recorded at representative midline electrodes (AFz, Fz, FCz, Cz, CPz, Pz, POz and Oz sites of 10–20 system). These potentials were obtained averaging separately not seen, and seen trials. [Color figure can be viewed in the online issue, which is available at www.interscience.wiley.com.]
Figure 6
Figure 6
Grand means (± SE) of not seen and seen LORETA solutions, which represented the significant interaction between the factors condition and lobe of interest. P3 source strength was used as dependent variable. The ANOVA analysis included factors such as condition, hemisphere, and lobe of interest. Duncan post hoc testing indicated that LORETA solutions were stronger in amplitude in seen than not seen P3 sources in dorsolateral prefrontal (BA 8; P < 0.007) and lateral premotor (BA 6; P < 0.008) regions of interest. [Color figure can be viewed in the online issue, which is available at www.interscience.wiley.com.]
Figure 7
Figure 7
Grand means (±SE) (N = 5) of LORETA P3 solutions for the factors condition (not seen and seen), task (cue‐based, target‐based and not inverted task), and lobe of interest (prefrontal BA 8, premotor BA 6, posterior parietal BA 7, occipital BA 19). [Color figure can be viewed in the online issue, which is available at www.interscience.wiley.com.]

References

    1. Babiloni F,Babiloni C,Fattorini L,Carducci F,Onorati P,Urbano A ( 1995): Performances of surface Laplacian estimators: A study of simulated and real scalp potential distributions. Brain Topogr Fall 8: 35–45. - PubMed
    1. Babiloni C,Bares M,Vecchio F,Brazdil M,Jurak P,Moretti DV,Ubaldi A,Rossini PM,Rektor I ( 2004): Synchronization of gamma oscillations increases functional connectivity of human hippocampus and inferior‐middle temporal cortex during repetitive visuomotor events. Eur J Neurosci 19: 3088–3098. - PubMed
    1. Babiloni C,Vecchio F,Bultrini A,Romani GL,Rossini PM ( 2005): Pre‐ and poststimulus alpha rhythms are related to conscious visual perception: A high‐resolution EEG study. Cereb Cortex 16: 1690–1700. - PubMed
    1. Babiloni C,Vecchio F,Miriello M,Romani GL,Rossini PM ( 2006a): Visuo‐spatial consciousness and parieto‐occipital areas: A high‐resolution EEG study. Cereb Cortex 16: 37–46. - PubMed
    1. Babiloni C,Vecchio F,Rossi S,De Capua A,Bartalini S,Ulivelli M,Rossini PM ( 2006b): Human ventral parietal cortex plays a functional role on visuospatial attention and primary consciousness. A repetitive transcranial magnetic stimulation study. Cereb Cortex 17: 1486–1492. - PubMed

Publication types