

Modeling linkage disequilibrium in exact linkage computations: a comparison of first-order Markov approaches and the clustered-markers approach
- PMID: 18466504
- PMCID: PMC2367570
- DOI: 10.1186/1753-6561-1-s1-s159
Modeling linkage disequilibrium in exact linkage computations: a comparison of first-order Markov approaches and the clustered-markers approach
Abstract
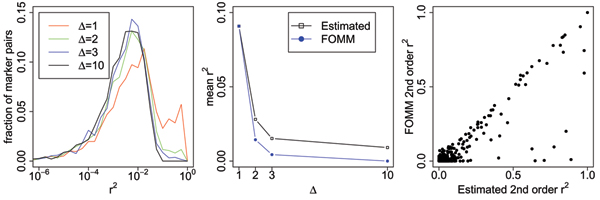
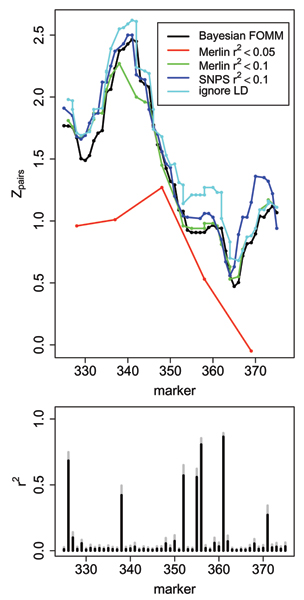
Recent studies have shown that linkage disequilibrium (LD) between single-nucleotide polymorphism (SNP) markers is widespread. Assuming linkage equilibrium has been shown to cause false positives in linkage studies where parental genotypes are not available. Therefore, linkage analysis methods that can deal with LD are required to accurately analyze SNP marker data sets. We compared three approaches to deal with LD between markers: 1) The clustered-markers approach implemented in the computer program MERLIN; 2) The standard hidden Markov model (HMM) multipoint model augmented with a first-order Markov model for the allele frequencies of the founders, in which we considered both a Bayesian and a maximum-likelihood implementation of this approach; 3) The 'independent' SNPs approach, i.e., removing SNPs from the data set until the remaining SNPs have low levels of LD.We evaluated these approaches on the Illumina 6K SNP data set of affected sib-pairs of Problem 2. We found that the first-order Markov model was able to account for most of the strong LD in this data set. The difference between the Bayesian and maximum- likelihood implementation was small. An advantage of the first-order Markov model is that it does not require the user to specify parameters.
Figures
Similar articles
-
Handling marker-marker linkage disequilibrium: pedigree analysis with clustered markers.Am J Hum Genet. 2005 Nov;77(5):754-67. doi: 10.1086/497345. Epub 2005 Sep 20. Am J Hum Genet. 2005. PMID: 16252236 Free PMC article.
-
The effect of linkage disequilibrium on linkage analysis of incomplete pedigrees.BMC Genet. 2005 Dec 30;6 Suppl 1(Suppl 1):S6. doi: 10.1186/1471-2156-6-S1-S6. BMC Genet. 2005. PMID: 16451672 Free PMC article.
-
Linkage disequilibrium inflates type I error rates in multipoint linkage analysis when parental genotypes are missing.Hum Hered. 2005;59(4):220-7. doi: 10.1159/000087122. Epub 2005 Jul 26. Hum Hered. 2005. PMID: 16093727 Free PMC article.
-
The affected-/discordant-sib-pair design can guarantee validity of multipoint model-free linkage analysis of incomplete pedigrees when there is marker-marker disequilibrium.Am J Hum Genet. 2006 Aug;79(2):396-401. doi: 10.1086/506331. Epub 2006 Jun 26. Am J Hum Genet. 2006. PMID: 16826532 Free PMC article.
-
A general model for likelihood computations of genetic marker data accounting for linkage, linkage disequilibrium, and mutations.Int J Legal Med. 2015 Sep;129(5):943-54. doi: 10.1007/s00414-014-1117-7. Epub 2014 Nov 26. Int J Legal Med. 2015. PMID: 25425094
Cited by
-
Finding disease genes: a fast and flexible approach for analyzing high-throughput data.Eur J Hum Genet. 2011 Oct;19(10):1090-4. doi: 10.1038/ejhg.2011.81. Epub 2011 May 25. Eur J Hum Genet. 2011. PMID: 21610749 Free PMC article.
-
A system for exact and approximate genetic linkage analysis of SNP data in large pedigrees.Bioinformatics. 2013 Jan 15;29(2):197-205. doi: 10.1093/bioinformatics/bts658. Epub 2012 Nov 18. Bioinformatics. 2013. PMID: 23162081 Free PMC article.
-
Multipoint approximations of identity-by-descent probabilities for accurate linkage analysis of distantly related individuals.Am J Hum Genet. 2008 Mar;82(3):607-22. doi: 10.1016/j.ajhg.2007.12.016. Am J Hum Genet. 2008. PMID: 18319071 Free PMC article.
-
Linkage analysis with dense SNP maps in isolated populations.Hum Hered. 2009;68(2):87-97. doi: 10.1159/000212501. Epub 2009 Apr 9. Hum Hered. 2009. PMID: 19365135 Free PMC article.
References
-
- Jensen FV. An Introduction to Bayesian Networks. London: UCL Press; 1996.
LinkOut - more resources
Full Text Sources
Research Materials
