. 2008 Jul 15;586(14):3337-51.
doi: 10.1113/jphysiol.2007.149286. Epub 2008 May 8.

Preferential motor unit loss in the SOD1 G93A transgenic mouse model of amyotrophic lateral sclerosis

Affiliations

Preferential motor unit loss in the SOD1 G93A transgenic mouse model of amyotrophic lateral sclerosis

J Hegedus et al. J Physiol. .

Abstract

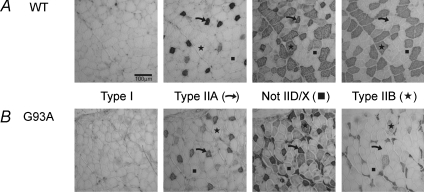
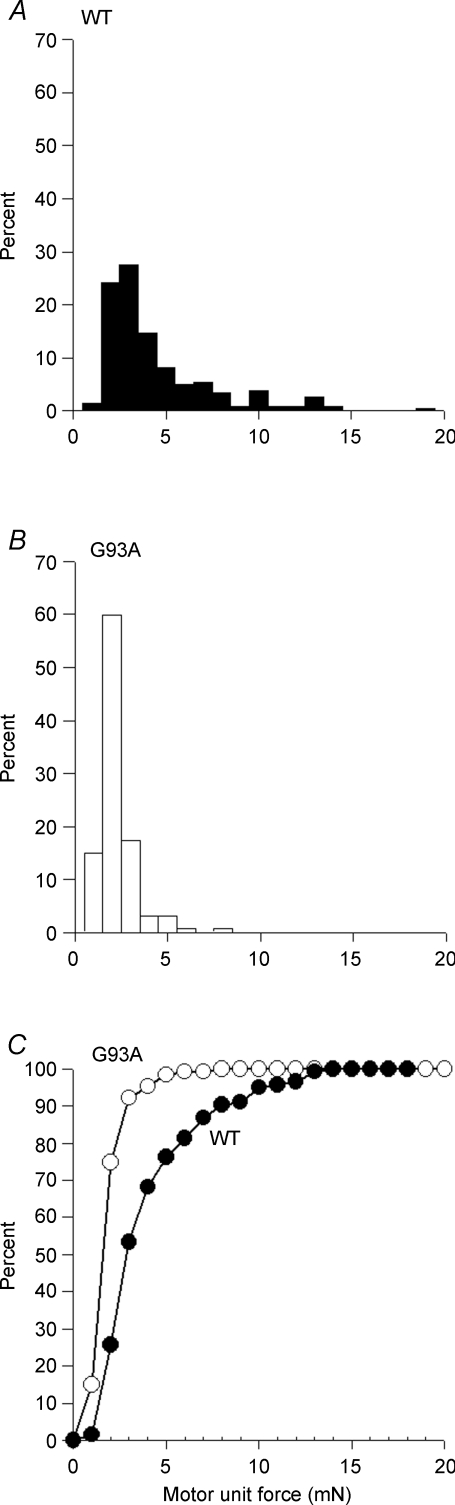
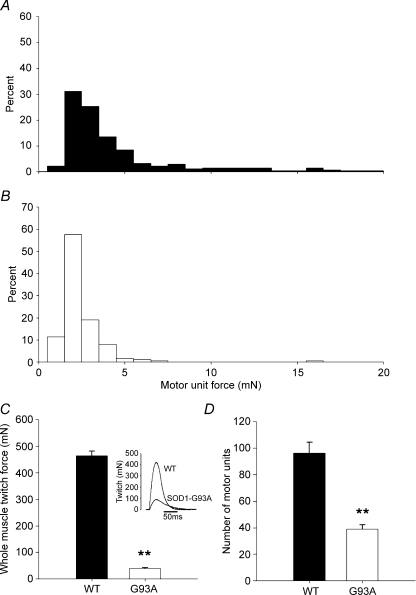
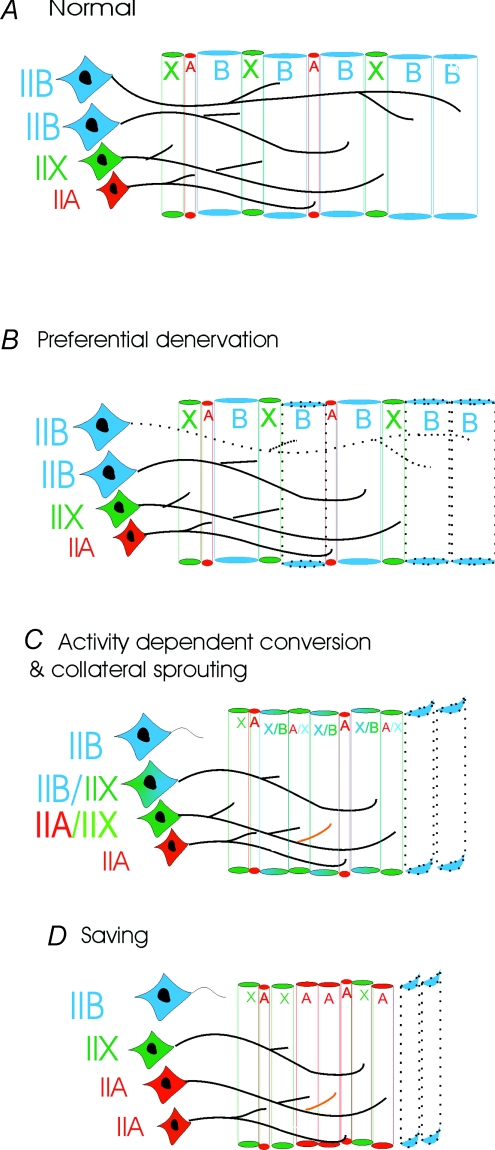
The present study investigated motor unit (MU) loss in a murine model of familial amyotrophic lateral sclerosis (ALS). The fast-twitch tibialis anterior (TA) and medial gastrocnemius (MG) muscles of transgenic SOD1(G93A) and SOD1(WT) mice were studied during the presymptomatic phase of disease progression at 60 days of age. Whole muscle maximum isometric twitch and tetanic forces were 80% lower (P < 0.01) in the TA muscles of SOD1(G93A) compared to SOD1(WT) mice. Enumeration of total MU numbers within TA muscles showed a 60% reduction (P < 0.01) within SOD1(G93A) mice (38 +/- 7) compared with SOD1(WT) controls (95 +/- 12); this was attributed to a lower proportion of the most forceful fast-fatigable (FF) MU in SOD1(G93A) mice, as seen by a significant (P < 0.01) leftward shift in the cumulative frequency histogram of single MU forces. Similar patterns of MU loss and corresponding decreases in isometric twitch force were observed in the MG. Immunocytochemical analyses of the entire cross-sectional area (CSA) of serial sections of TA muscles stained with anti-neural cell adhesion molecule (NCAM) and various monoclonal antibodies for myosin heavy chain (MHC) isoforms showed respective 65% (P < 0.01) and 28% (P < 0.05) decreases in the number of innervated IIB and IID/X muscle fibres in SOD1(G93A), which paralleled the 60% decrease (P < 0.01) in the force generating capacity of individual fibres. The loss of fast MUs was partially compensated by activity-dependent fast-to-slower fibre type transitions, as determined by increases (P < 0.04) in the CSA and proportion of IIA fibres (from 4% to 14%) and IID/X fibres (from 31% to 39%), and decreases (P < 0.001) in the CSA and proportion of type IIB fibres (from 65% to 44%). We conclude that preferential loss of IIB fibres is incomplete at 60 days of age, and is consistent with a selective albeit gradual loss of FF MUs that is not fully compensated by sprouting of the remaining motoneurons that innervate type IIA or IID/X muscle fibres. Our findings indicate that disease progression in fast-twitch muscles of SOD1(G93A) mice involves parallel processes: (1) gradual selective motor axon die-back of the FF motor units that contain large type IIB muscle fibres, and of fatigue-intermediate motor units that innervate type IID/X muscle fibres, and (2) activity-dependent conversion of motor units to those innervated by smaller motor axons innervating type IIA fatigue-resistant muscle fibres.


Figures

Figure 1
Figure 1. Schematic illustration of the experimental set-up for recording whole muscle and motor unit contractile force from mouse tibialis anterior (TA) or medial gastrocnemius (MG) muscles
A, supra-maximal stimulation of the sciatic nerve through silver wire electrodes elicits whole muscle contractile twitch and tetanic forces; stimulation of teased ventral root filaments resulted in all-or-none motor unit contractile force. B, as the amplitude of the stimulation to the teased ventral roots increases, motor units with higher thresholds are progressively recruited, resulting in the incremental increase of the recorded muscle contractile force. Template subtraction was used to calculate the force of the recruited motor units, and the number of motor units was estimated by dividing the whole muscle twitch force by the average motor unit force. The complete time scale of the recorded twitch forces of the muscle and motor units is 100 ms.
Figure 2
Figure 2. Immunohistochemical staining for type I, IIA, not IID/X and IIB fibres on 12 μm thick cross-sections of TA muscles from SOD1WT (A) and SOD1G93A (B) mice
Staining was completed using anti-myosin heavy chain (MHC) monoclonal antibodies: type I fibres (anti-MHCI, clone BA-D5); type IIA fibres (anti-MHCIIa, clone SC-71); type IID/X fibres are unstained (anti-MHC not IIX (also known as not IID), clone BF-35); type IIB fibres (anti-MHCIIb, clone BF-F3). The scale bar is 100 μm.
Figure 3
Figure 3. There was a significant decline in the whole muscle twitch (A), the tetanic contractile forces (B) and the number of intact motor units (C) in the SOD1G93A mouse TA muscles as compared to control SOD1WT muscles
A, representative tracing of whole muscle twitch force indicating a decline in twitch force and a concomitant increase in the half-relaxation time of the muscle. The whole muscle twitch and tetanic forces decline in parallel (A and B) to approximately a fifth of the control SOD1WT mouse TA muscle values. Motor unit loss in TA muscles of SOD1G93A mice paralleled the reductions in whole muscle twitch and tetanic force production and accounted for the higher proportion of smaller less forceful motor units. Data are presented as means ± s.e.m. and statistical significance is indicated as ** for P < 0.01.
Figure 4
Figure 4. Changes in the frequency distributions of motor unit twitch forces in SOD1G93A mouse TA muscles, as compared to age matched SOD1WT control mouse TA muscles
A, in the SOD1WT the distribution was skewed toward large motor units; the minimum motor unit force was 0.5 mN and the maximum was 18.4 mN. Approximately one-third of all motor units produced forces above 4.0 mN. B, in the SOD1G93A mouse muscles, the average motor unit force was half that of the SOD1WT mouse TA muscles, and only one-tenth of the motor units produced forces above 4.0 mN; the maximum motor unit force was only 8.1 mN. C, the increase in the proportion of less forceful motor units is best illustrated by a cumulative frequency histogram. There was a significant (P < 0.01) leftward shift of motor unit forces, demonstrating loss of the most forceful motor units and an increase in size of the smaller motor units.
Figure 5
Figure 5. Representative cross-sections of TA muscles in 60-day-old SOD1WT and SOD1G93A mice that have been stained for neural cell adhesion molecule (NCAM) to identify NCAM positive, denervated muscle fibres
In SOD1WT mouse TA muscles (A), the fibres did not express NCAM, indicating that they were all normally innervated. In the SOD1G93A mouse TA muscles (B), numerous muscle fibres expressed NCAM. The number of NCAM negative muscle fibres that were innervated by motor axons is summarized in Fig. 6. Representative photomicrographs of TA muscles from SOD1WT (C) and SOD1G93A (D) mice are immunostained with anti-MHCIIb monoclonal antibody (clone BF-F3), which labels type IIB fibres. There was considerable whole muscle and type IIB fibre atrophy of the muscles of SOD1G93A mice compared with SOD1WT. There was also overt loss of type IIB fibres, particularly from the superficial regions of TA muscles from SOD1G93A mice. The scale bar in A is 100 μm; the scal bar in D is 1 mm.
Figure 6
Figure 6. The number of innervated muscle fibres (A), muscle fibres per motor unit (B) and force produced per muscle fibre (C)
The average number of muscle fibres per motor unit (innervation ratio; IR) in the SOD1G93A mouse TA muscle tended to increase by approximately 44%, compared to age-matched control SOD1WT. Despite the relatively static IR, the force produced by each motor unit declined (Fig. 4), indicating that the contractile force producing capacity of each motor unit was reduced. Data are presented as means ± s.e.m. and statistical significance is indicated as ** for P < 0.01.
Figure 7
Figure 7. The percentage of innervated muscle fibres plotted as distributions of fibre cross-sectional areas (CSAs) in the SOD1WT (A–C) and SOD1G93A mouse (D–E) TA muscles
In B and E, the number of each type of innervated fibre is plotted as a percentage of the total number of innervated fibres. In C and F, the number of innervated muscle fibres of each type is plotted as a percentage of the total muscle CSA (i.e. fibre area density). In A and D, mean ± s.d. of the muscle fibre CSAs are shown. In B, C, E and F, the percentage values indicate the relative proportions of type IIA, IID/X and IIB muscle fibres and the inverted triangles show the mean CSA for each muscle fibre type. A, in the SOD1WT mouse TA muscle, the distribution of fibre CSAs was skewed towards the right, with a high proportion of muscle fibres having large CSA. B, the skewed distribution was accounted for by the differences in the proportion of the different muscle fibre types; the greatest proportion of muscle fibres was the large type IIB in the SOD1WT mouse TA muscle. C, when the number of muscle fibres of each type is expressed as a percentage of whole muscle CSA, it becomes clear that 80% of the muscle CSA is occupied by the large type IIB muscle fibres in the SOD1WT mouse TA muscle. D, the distribution of CSA in the SOD1G93A mouse TA muscle was also skewed, but the range of CSA and the average CSA were both smaller than in age matched SOD1WT mice. E, the different distribution was due to both a change in the proportion of muscle fibre types with substantially fewer type IIB fibres and a decrease in the average CSA of the type IIB muscle fibres. In addition to the decline in the average CSA of type IIB fibres, the type IIA fibres were larger, resulting in smaller differences between the mean CSA of type IIA, IID/X and IIB fibres. F, the proportions of innervated muscle fibres expressed as a percentage of the whole muscle CSA (fibre area density) was the same as the proportions of innervated muscle fibres expressed as a percentage of the total number of innervated muscle fibres.
Figure 8
Figure 8. Median cross-sectional area (A) and mean number (B) of innervated fibres of TA muscles that were classified on the basis of MHC isoform immunohistochemistry
A, the median CSA of type IIB muscle fibres was significantly smaller in the TA muscles of SOD1G93A mice compared with those of SOD1WT mice. Conversely, type IIA and IID/X fibres were significantly larger. Significant differences were determined with a non-parametric test, as fibre cross-sectional area data were not normally distributed (see Fig. 6). B, the numbers (mean ± s.e.m.) of innervated type IIB and type IID/X fibres were reduced by 61% and 28% in SOD1G93A mouse TA, respectively. The number of type IIA muscle fibres in SOD1G93A mouse TA increased by almost 2-fold, as compared to SOD1WT mouse TA muscle. There were no innervated muscle fibres that coexpressed two or more MHC isoforms in the SOD1WT TA muscle, while a small proportion of muscle fibres coexpressed two different MHC isoforms in the SOD1G93A mouse TA muscle. Statistical significance is indicated as * for P < 0.05 and ** for P < 0.01.
Figure 9
Figure 9. Motor unit force declined in medial gastrocnemius (MG) muscles, in parallel with a decline in whole muscle twitch force and a loss of functional motor units
A, in normal 60-day-old SOD1WT mouse MG muscles the distribution of motor unit forces was skewed towards the left, with a high proportion of less forceful motor units. B, the distribution of motor units in the SOD1G93A mouse MG muscle was also skewed to the left, but there was only one motor unit that had a force greater than ∼6 mN (C). In parallel with the loss of the most forceful motor units from the MG, the whole muscle twitch force declined by ∼80%. A representative force tracing is seen in the inset. D, similar to the TA muscle (Fig. 3C), the number of intact motor units in the MG also declined by ∼60% in 60-day-old SOD1G93A mice.
Figure 10
Figure 10. A possible mechanism to describe neuromuscular change in presymptomatic SOD1G93A mouse TA muscles
A, normal; in the age-matched control SOD1WT mouse TA muscles fibres are innervated by intact motor axons, and there is no coexpression of myosin heavy chains. B, preferential denervation; in early presymptomatic stages there is withdrawal of axon branches preferentially from the largest motor units, which innervate type IIB muscle fibres. C, activity-dependent conversion and collateral sprouting; not all of the motoneurons that innervate type IIB fibres die back, and those motor units that remain intact increase their activity to compensate for the selective and progressive loss of functional motor units. As a result of increased activity, the remaining muscle fibres change to slower, more oxidative phenotypes via coexpression of myosin heavy chains. This conversion is first evidenced by a decrease in CSA of the muscle fibres. There is also some collateral axonal sprouting from the intact motor units that innervate type IIA and IID/X muscle fibres, resulting in coexpression of muscle fibre myosin heavy chains. D, saving; collateral sprouting and activity-dependent conversion result in a progressive increase in the number of type IIA and IIX muscle fibres within motor units that become progressively enlarged by sprouting. The lower force production of the smaller muscle fibres in these surviving motor units does not compensate for the ongoing die-back and loss of the more forceful large motor units containing type IIB muscle fibres. Denervated muscle fibres that are not reinnervated become angulated and atrophy. Eventually, the proportion of type IIB muscle fibres becomes very low. As the type IIB muscle fibres produce the greatest amounts of force, the average force producing capacity of the remaining muscle fibres that are innervated by the remaining type IIA and type IIX motoneurons is reduced.

Similar articles

Cited by

References

    1. Atkin JD, Scott RL, West JM, Lopes E, Quah AK, Cheema SS. Properties of slow- and fast-twitch muscle fibres in a mouse model of amyotrophic lateral sclerosis. Neuromuscul Disord. 2005;15:377–388. - PubMed
    1. Azzouz M, Leclerc N, Gurney M, Warter JM, Poindron P, Borg J. Progressive motor neuron impairment in an animal model of familial amyotrophic lateral sclerosis. Muscle Nerve. 1997;20:45–51. - PubMed
    1. Brown WF, Milner-Brown HS. Some electrical properties of motor units and their effects on the methods of estimating motor unit numbers. J Neurol Neurosurg Psychiatry. 1976;39:249–257. - PMC - PubMed
    1. Chiu AY, Zhai P, Dal Canto MC, Peters TM, Kwon YW, Prattis SM, Gurney ME. Age-dependent penetrance of disease in a transgenic mouse model of familial amyotrophic lateral sclerosis. Mol Cell Neurosci. 1995;6:349–362. - PubMed
    1. Cleveland DW. From Charcot to SOD1: mechanisms of selective motor neuron death in ALS. Neuron. 1999;24:515–520. - PubMed

Publication types