. 2008 Aug;149(8):4024-34.
doi: 10.1210/en.2007-1669. Epub 2008 May 8.

The G protein-coupled receptor GPR30 inhibits human urothelial cell proliferation

Affiliations

The G protein-coupled receptor GPR30 inhibits human urothelial cell proliferation

Jian Teng et al. Endocrinology. 2008 Aug.

Abstract

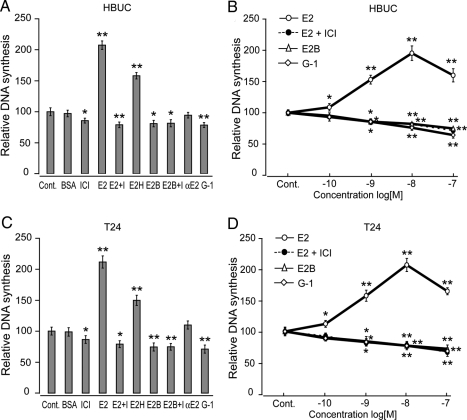
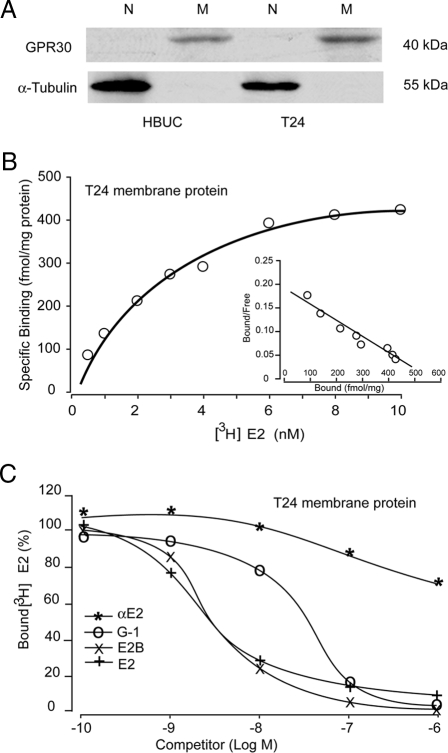
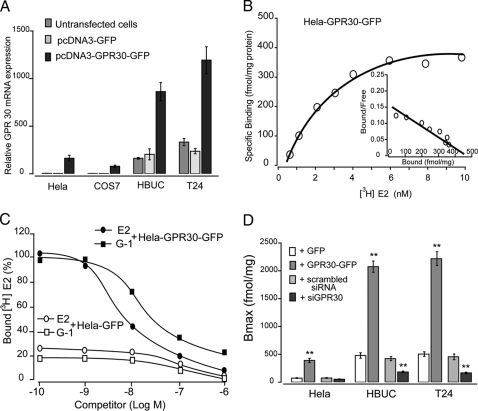
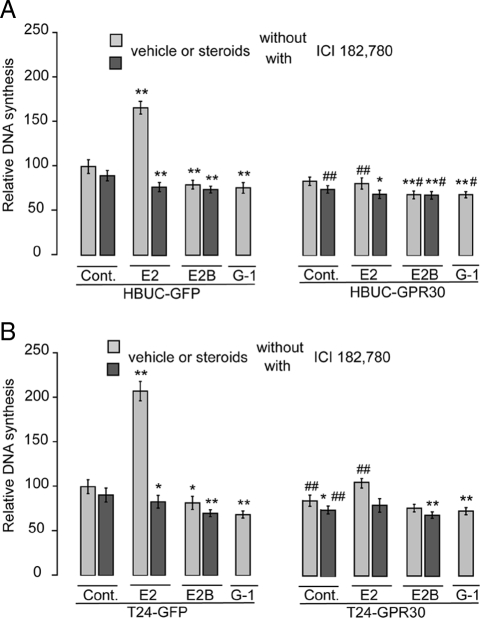
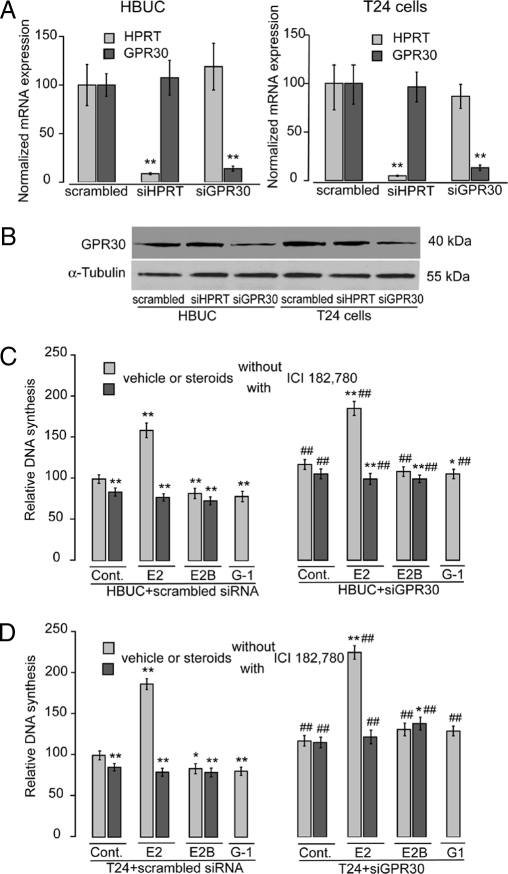
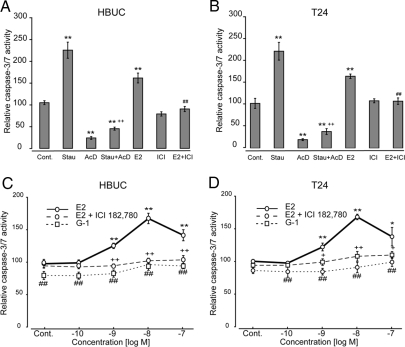
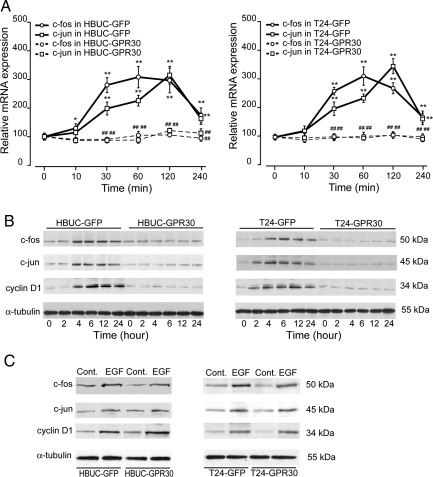
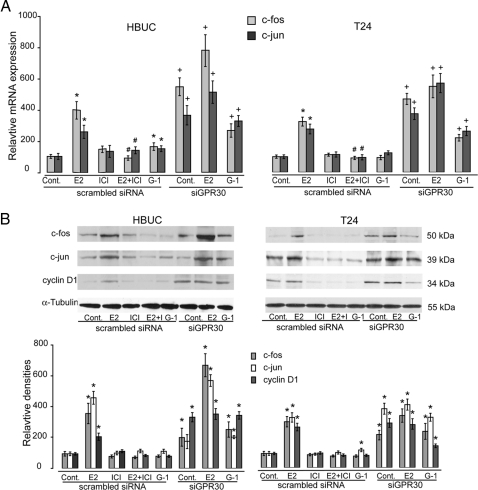
We have previously shown that estrogen stimulates cell proliferation in both normal and transformed urothelial cells mainly through activation of the two primary estrogen receptors (ERs), ERalpha and ERbeta. A growing body of evidence suggests that estrogen also initiates nongenomic effects that cannot be explained by activation of primary ERs. In the present study, we observed that urothelial cells express high amounts of GPR30, a G protein-coupled receptor recently identified as a candidate for membrane-associated estrogen binding. Membrane- impermeable bovine serum albumin-conjugated 17beta-estradiol and the specific GPR30 agonist G-1 both inhibited urothelial cell proliferation in a concentration-dependent manner. Transient overexpression of GPR30 inhibited 17beta-estradiol (E2)-induced cell proliferation. Decreased GPR30 expression caused by specific small interfering RNA increased E2-induced cell proliferation. These results indicate that membrane-associated inhibitory effects of E2 on cell proliferation correlate with abundance of GPR30. Although E2 induced a significant increase in caspase-3/7 activity, G-1 did not, suggesting that the GPR30-mediated inhibitory effect on cell proliferation was not caused by apoptosis. Furthermore, we found that G-1 failed to induce c-fos, c-jun, and cyclin D1 expression, and GPR30 overexpression abolished E2-induced c-fos, c-jun, and cyclin D1 expression. However, inactivation of GPR30 by small interfering RNA increased c-fos, c-jun, and cyclin D1 expression. These results suggest that GPR30-mediated inhibition of urothelial cell proliferation is the result of decreased cyclin D1 by down-regulation of activation protein-1 signaling.


Figures

Figure 1
Figure 1
E2B or the GPR30 agonist G-1 inhibits human urothelial cell proliferation. A, HBUCs or T24 human bladder cancer cells (C) were treated with vehicle [0.1% (dimethylsulfoxide) plus 0.9% ethanol, control (Cont)], 0.1% BSA, 100 nm ICI 182,780 (ICI), 10−8 m E2 in the absence (E2) or presence [E2 plus I (ICI)] of 10−7 m ICI 182,780, 10−8 m E2H, 10−8 m E2B or presence (E2B plus I) of 10−7 m ICI 182,780, 10−8 m 17α-E2 (αE2), and 10−8 m GPR30 agonist G-1 for 16 h. B, HBUCs or T24 cells (D) were treated with 10−10 to 10−7 m E2 in the absence or presence of 10−7 m ICI 182,780, 10−10 to 10−7 m E2B, or 10−10 to 10−7 m G1 for 16 h. Cells were labeled with 0.5 μCi of [methyl-3H]thymidine to determine DNA synthesis. Relative increases in DNA synthesis were normalized to the average of vehicle-treated cells, which was arbitrarily set at 100. Each point represents the mean ± sem of four independent experiments using different primary cultures for HBUCs or separate T24 cell preparations performed in quadruplicate. *, P < 0.05; **, P < 0.01, compared with vehicle-treated cells.
Figure 2
Figure 2
Human urothelial cells express GPR30. A, Nuclear (N) and membrane (M) proteins from HBUCs and T24 cells were enriched. GPR30 protein was detected only in membrane fractions but not in nuclear fractions by immunoblotting using a specific antibody against human GPR30. α-Tubulin was detected only in nuclear fractions, but not in membrane fractions. Blots representative of four separate experiments are shown. B, Representative saturation curve and Scatchard plot (inset) of specific [3H]E2 binding to membrane protein preparations from T24 cells. C, Competition binding curves for [3H]E2 in the presence of E2, E2B, G1, or αE2 using membrane protein preparations from T24 cells. The maximum specific [3H]E2 binding was arbitrarily set at 100.
Figure 3
Figure 3
Overexpression of GPR30. A, GPR30 was overexpressed as a fusion protein with enhanced GFP in HeLa, COS-7, HBUCs, and T24 cells. Semiquantitative real-time PCR shows GPR30 mRNA in untransfected, pcDNA3-GFP-transfected, or pcDNA3-GPR30-GFP-transfected cells. Results are normalized to S26 ribosomal mRNA expression in the same sample. B, Representative saturation curve and Scatchard plot (inset) of specific [3H]E2 binding to membrane protein preparations from pcDNA3- GPR30-GFP-transfected HeLa cells. C, Competition binding curves for E2 and G-1 to membrane protein preparations from pcDNA3-GFP or pcDNA3-GPR30-GFP-transfected HeLa cells. The maximum specific [3H]E2 binding to the membrane protein preparations from pcDNA3-GFP-transfected HeLa cells was arbitrarily set at 100. D, The maximum specific [3H]E2 binding to membrane protein preparations from HeLa, HBUCs, or T24 cells transfected with vectors coding GFP or GPR30-GFP, scrambled siRNA, or siRNA against GPR30. Data represent the mean ± sem of three separate experiments. **, P < 0.01, compared with control (transfected with GFP or scrambled siRNA).
Figure 4
Figure 4
GPR30 overexpression inhibits E2-induced cell proliferation in urothelial cells. HBUCs (A) and T24 cells (B) were transfected with pcDNA3-GFP or pcDNA3-GPR30-GFP vectors and treated with 10−8 m E2 or E2B in the presence or absence of 100 nm ICI 182,780, or 10−8 m G1 alone. DNA synthesis was determined using the [methyl-3H]thymidine incorporation assay. Relative increases in DNA synthesis were normalized to the average of vehicle-treated cells, which was arbitrarily set at 100. Data represent the mean ± sem of four independent experiments using different primary cultures for HBUCs or separate T24 cell preparations performed in quadruplicate. *, P < 0.05; **, P < 0.01, compared with vehicle-treated cells. #, P < 0.05; ##, P < 0.01. GPR30-expressing cells compared with GFP-expressing cells. Cont, Control.
Figure 5
Figure 5
siRNA against GPR30 increases E2-induced cell proliferation in urothelial cells. HBUCs and T24 cells were transfected with 10−8 m scrambled siRNA, siRNA against GPR30, or HPRT-S1 positive control (Cont) siRNA. A, Semiquantitative real-time PCR for GPR30 and HPRT mRNA in scrambled-, siRNA against HPRT-, or siRNA against GPR30-transfected HBUCs or T24 cells. Results are normalized to S26 ribosomal mRNA expression in the same sample. **, P < 0.01, compared with scrambled siRNA-transfected cells. B, Representative immunoblotting for GPR30 in membrane proteins from scrambled-, siRNA against HPRT-, or siRNA against GPR30-transfected HBUCs or T24 cells. C, Transfected HBUCs or T24 cells (D) were treated with 10−8 m E2 or E2B in the presence or absence of 10−7 m ICI 182,780, or 10−8 m G1 alone. DNA synthesis was determined using the [3H]thymidine incorporation assay. Relative increases in DNA synthesis were normalized to the average of vehicle-treated cells, which was arbitrarily set at 100. Data represent the mean ± sem of four independent experiments using different primary cultures for HBUCs or separate T24 cell preparations performed in quadruplicate. *, P < 0.05; **, P < 0.01, compared with vehicle-treated cells. ##, P < 0.01, compared with scrambled siRNA-treated cells.
Figure 6
Figure 6
E2-induced cell apoptosis is independent of GPR30. HBUCs (A) or T24 cells (B) were treated with 10−8 m E2 in the presence or absence of 10−7 m ICI 182,780. Staurosporine (Stau) (10−7 m) was used as a positive control (Cont) to induce cell apoptosis, and Ac-DEVD-CHO (AcD) (10 μm) was used as a negative control. **, P < 0.01, compared with vehicle-treated cells. ++, P < 0.01, Staurosporine-treated cells vs. Staurosporine-treated cells in the presence of Ac-DEVD-CHO. ##, P < 0.01, cells in the presence of ICI 182,780 and E2 compared with results from cells treated with ICI 182,780 alone. HBUCs (C) or T24 cells (D) were treated with 10−10 to 10−7 m E2 in the presence or absence of 10−7 m ICI 182,780, or 10−10 to 10−7 m G-1 alone. Relative caspase-3/7 activity was calculated by setting the average fluorescence units of vehicle-treated cells in each group to 100 (corresponds to 600–1000 fluorescence units at 485 ± 20 nm excitation/530 ± 25 nm emission and sensitivity = 25). Data represent the mean ± sem of four independent experiments using different primary cultures for HBUCs or separate T24 cell preparations performed in quadruplicate. **, P < 0.01, compared with vehicle-treated cells. ++, P < 0.01, G-1-treated cells compared with E2-treated cells. ##, P < 0.01, cells in the absence of ICI 182,780 compared with cells in the presence of ICI 182,780.
Figure 7
Figure 7
GPR30-mediated effects on cell growth are not dependent on receptor expression or ERK activation. A, HBUCs or T24 cells were treated with 10−8 m E2, E2B, G-1, 10−7 m ICI 182,780, or a combination of E2 and ICI 182,780 for 16 h. Whole cell lysates were blotted for human ERα, ERβ, and GPR30. Human α-tubulin was used as a loading control (Cont). Blots representative of four separate experiments are shown. B, HBUCs or T24 cells were transfected with pcDNA3-GFP or pcDNA3-GPR30 and then treated with 10−8 m E2 for up to 60 min. Whole cell lysates were blotted for phosphorylated (p)-ERK1/2 and ERK-1. Blots representative of four independent experiments using different primary cultures for HBUCs or separate T24 cell preparations are shown. E2+I, E2 + ICI 182,780.
Figure 8
Figure 8
GPR30 overexpression down-regulates expression of c-fos, c-jun, and cyclin D1. A, HBUCs or T24 cells were transfected with pcDNA3-EGFP or pcDNA3-GPR30 and treated with 10−8 m E2 for up to 4 h. Expression of c-fos or c-jun mRNA was determined by semiquantitative real-time PCR. Results are normalized to S26 ribosomal mRNA expression in the same sample. Data represent the mean ± sem of four different primary cultures or four separate T24 cell preparations. **, P < 0.01, compared with vehicle-treated cells. ##, P < 0.01, GPR30-expressing cells compared with GFP-expressing cells. B, Transfected HBUCs or T24 cells were treated with 10−8 m E2 for up to 24 h. Expression of c-fos, c-jun, or cyclin D1 proteins was determined by immunoblotting using specific antibodies. Blots representative of four independent experiments using different primary cultures for HBUCs or separate T24 cell preparations are shown. C, Transfected HBUCs or T24 cells were treated with 50 ng/ml rhEGF for 4 h. Expression of c-fos, c-jun, or cyclin D1 proteins was determined by immunoblotting. Blots representative of four independent experiments using different primary cultures for HBUCs or separate T24 cell preparations are shown. Cont, Control.
Figure 9
Figure 9
siRNA against GPR30 increases c-fos, c-jun, and cyclin D1. A, HBUCs or T24 cells were transfected with scrambled siRNA or siRNA against GPR30 and treated with 10−8 m E2, G-1, 10−7 m ICI 182,780, or a combination of E2 and ICI 182,780 for 4 h. Expression of c-fos or c-jun mRNA was determined by semiquantitative real-time PCR. Results are normalized to S26 ribosomal mRNA expression in the same sample. Data represent the mean ± sem of four separate cDNA preparations. *, P < 0.01, compared with vehicle-treated cells. #, P < 0.01, compared with cells treated with E2 alone. +, P < 0.01, cells treated with siRNA against GPR30 compared with cells treated with scrambled siRNA. B, HBUCs or T24 cells were transfected with scrambled siRNA or siRNA against GPR30 and treated with 10−8 m E2, G-1, 10−7 m ICI 182,780, or a combination of E2 and ICI 182,780 for 16 h. Expression of c-fos, c-jun, or cyclin D1 was determined by immunoblotting using specific antibodies. Blots representative of four separate experiments are shown. The average density of vehicle-treated scrambled siRNA-transfected cells was arbitrarily set at 100%. Data represent the mean ± sem of four separate experiments. *P < 0.01, compared with vehicle-treated scrambled siRNA-transfected cells. Cont, Control.

Similar articles

Cited by

References

    1. Kuiper GG, Shughrue PJ, Merchenthaler I, Gustafsson JA 1998 The estrogen receptor β subtype: a novel mediator of estrogen action in neuroendocrine systems. Front Neuroendocrinol 19:253–286 - PubMed
    1. Song RX, Santen RJ 2006 Membrane initiated estrogen signaling in breast cancer. Biol Reprod 75:9–16 - PubMed
    1. Mendelsohn ME 2002 Genomic and nongenomic effects of estrogen in the vasculature. Am J Cardiol 90:3F–6F - PubMed
    1. Razandi M, Pedram A, Greene GL, Levin ER 1999 Cell membrane and nuclear estrogen receptors (ERs) originate from a single transcript: studies of ERα and ERβ expressed in Chinese hamster ovary cells. Mol Endocrinol 13:307–319 - PubMed
    1. Flouriot G, Brand H, Denger S, Metivier R, Kos M, Reid G, Sonntag-Buck V, Gannon F 2000 Identification of a new isoform of the human estrogen receptor-α (hER-α) that is encoded by distinct transcripts and that is able to repress hER-α activation function 1. EMBO J 19:4688–4700 - PMC - PubMed

Publication types

MeSH terms