. 2008 Aug;149(8):4209-17.
doi: 10.1210/en.2007-1679. Epub 2008 May 8.

Epididymis expresses the highest 5'-deiodinase activity in the male reproductive system: kinetic characterization, distribution, and hormonal regulation

Affiliations

Epididymis expresses the highest 5'-deiodinase activity in the male reproductive system: kinetic characterization, distribution, and hormonal regulation

Brenda Anguiano et al. Endocrinology. 2008 Aug.

Abstract

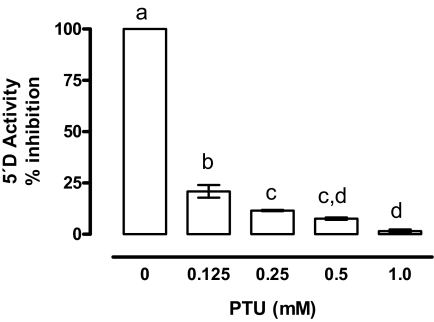
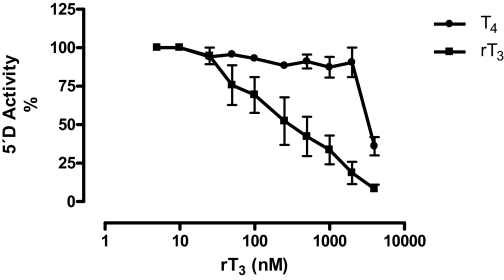
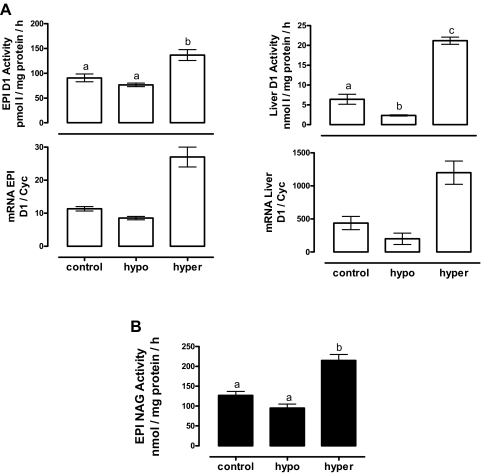
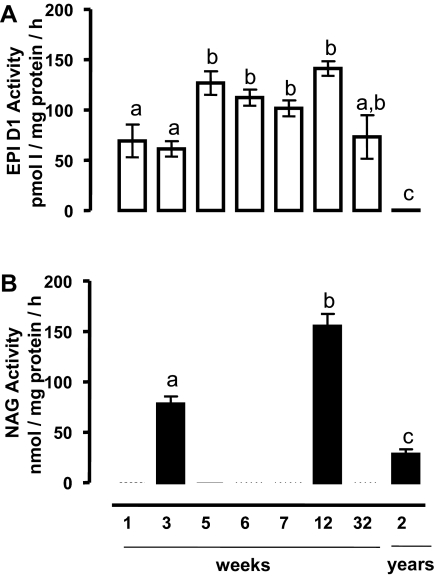
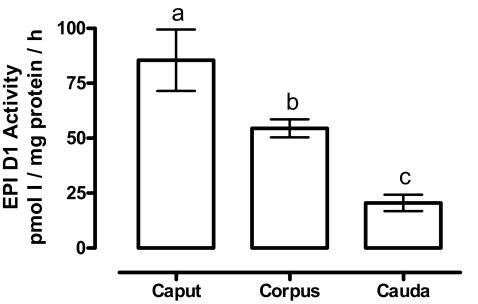
We characterized the enzymes that catalyze the deiodination of T(4) to T(3) in the male reproductive tract. Testis, epididymis (EPI), seminal vesicles, prostate, bulbourethral glands, spermatozoa, and semen were taken from sexually mature rats (300 g). Iodothyronine 5'-deiodinase (5'-D) activity was quantified by the radiolabeled-iodide-release method. 5'-D activity was 10-fold higher in EPI and semen than in the rest of the tissues. In EPI, semen, and prostate, the enzymatic activity was completely inhibited by 1 mm 6-n-propyl-2-thiouracil, whereas in the other tissues the inhibition was partial (50%). The high susceptibility to 6-n-propyl-2-thiouracil inhibition, a ping-pong kinetic pattern, and low cofactor (Michaelis Menten constant for dithiothreitol=0.7 mm) and high substrate (Michaelis Menten constant for reverse T(3)=0.4 microm) requirements indicate that EPI 5'-D corresponds to type 1 deiodinase (D1). Real-time RT-PCR amplification of D1 mRNA in this tissue confirms this conclusion. The highest EPI D1 expression occurred at the onset of puberty and sexual maturity, and in the adult, this activity was more abundant in corpus and caput than in the caudal region. EPI D1 expression was elevated under conditions of hyperthyroidism and with addition of 17beta-estradiol. Our data also showed a direct association between D1 and a functional epididymis marker, the neutral alpha-glucosidase enzyme, suggesting that local generation of T(3) could be associated with the development and function of EPI and/or spermatozoa maturation. Further studies are necessary to analyze the possible physiological relevance of 5'-D in the male reproductive system.


Figures

Figure 1
Figure 1
Regional distribution of 5′-D activity in the male reproductive tract. The assay was performed with 2.0 nm 125I-rT3, 150 μg protein, and 20 mm DTT in the absence or presence of 1.0 mm PTU. Incubation was 3 h at 37 C. Data were analyzed by a two-way ANOVA, and differences between means were evaluated by the Tukey test. Different letters indicate significant differences between groups (P ≤ 0.05, n = 5).
Figure 2
Figure 2
Inhibitory effect of PTU on EPI 5′-D activity. Data were normalized with respect to the 100% value corresponding to incubations performed in the absence of PTU, using 2 nm 125-rT3 and 5 mm DTT. Incubation was 1.5 h at 37 C. Data were analyzed by a one-way ANOVA, and differences between means were evaluated by the Tukey test. Different letters indicate significant differences between groups (P ≤ 0.01, n = 3 independent experiments, each in duplicate).
Figure 3
Figure 3
Substrate affinity assay for EPI 5′-D activity. A 100% value corresponds to incubations performed in the presence of 125I-rT3 (70,000 cpm) without unlabeled iodothyronines. A wide range of rT3 and T4 concentrations were tested (5–4000 nm) using 5 mm DTT and 100 μg protein. Incubation was 1.5 h at 37 C (n = 3 independent experiments, each in duplicate).
Figure 4
Figure 4
Kinetic parameters of EPI 5′-D activity. A, The rT3 concentrations were 125, 250, 500, and 1500 nm in the presence of 0.312, 0.625, 1.25, 2.5, and 5 mm DTT. The assay was performed with 50 μg of protein. Incubation was 1.5 h at 37 C. B, Lineweaver-Burk plot. C, The replots of intercepts from these data yielded the Km constants (n = 3 independent experiments, each in duplicate).
Figure 5
Figure 5
Effect of thyroid status on D1 expression (A) and NAG activity (B). Liver was used as positive control for D1 activity. Optimal assay conditions for EPI and liver D1 activity were used (see Materials and Methods). NAG was measured by a colorimetric test. The data were analyzed with a one-way ANOVA, and differences between means were evaluated by the Tukey test. Different letters indicate significant differences between groups (P ≤ 0.05, n = 6). Two independent RNA samples were used for mRNA analysis. Hypo, Hypothyroidism; hyper, hyperthyroidism.
Figure 6
Figure 6
Temporal profile of D1 and NAG activity at different stages of development and functionality of EPI. A, Optimal conditions for D1 activity were used (see Materials and Methods). B, NAG was measured by a colorimetric test. The data were analyzed with a one-way ANOVA, and differences between means were evaluated by the Tukey test. Different letters indicate significant differences between groups (P ≤ 0.05, n = 6).
Figure 7
Figure 7
Segment-specific distribution of EPI D1 activity. Optimal assay conditions for D1 activity were used (see Materials and Methods). The data were analyzed with a one-way ANOVA. Different superscript letters indicate significant differences between groups (P ≤ 0.001, n = 5).
Figure 8
Figure 8
Effects of castration and sex hormones on EPI D1 activity. A, Optimal assay conditions for D1 activity were used (see Materials and Methods). The data were analyzed with a one-way ANOVA, and differences between means were evaluated by the Tukey test. Different letters indicate significant differences between groups (P ≤ 0.05, n = 5). B, Two independent RNA samples were used for mRNA analysis.
Figure 9
Figure 9
Effect of E2 replacement on EPI D1 and NAG activity. A, Optimal assay conditions for EPI D1 activity were used (see Materials and Methods). B, NAG was measured in caput by a colorimetric test. The data were analyzed with a one-way ANOVA, and differences between means were evaluated by the Tukey test. Different letters indicate significant differences between groups (P ≤ 0.05, n = 5).
Figure 10
Figure 10
5′-Deiodinase activity in EPI, spermatozoa (Spz), and semen. Spz were obtained from the caput and caudal regions of the EPI. Assays were performed with 150 μg protein, 2.0 nm 125I-rT3, and 20 mm DTT in the presence or absence of 1 mm PTU. Incubation was 3 h at 37 C. The data were analyzed by the Student’s t test. *, P ≤ 0.001 for PTU vs. control (n = 3).

Similar articles

Cited by

References

    1. Jannini EA, Ulisse S, D'Armiento M 1995 Thyroid hormone and male gonadal function. Endocr Rev 16:443–459 - PubMed
    1. Cooke PS, Holsberger DR, Witorsch RJ, Sylvester PW, Meredith JM, Treinen KA, Chapin RE 2004 Thyroid hormone, glucocorticoids, and prolactin at the nexus of physiology, reproduction, and toxicology. Toxicol Appl Pharmacol 194:309–335 - PubMed
    1. Ariyaratne HB, Mendis-Handagama SM, Mason JI 2000 Effects of tri-iodothyronine on testicular interstitial cells and androgen secretory capacity of the prepubertal rat. Biol Reprod 63:493–502 - PubMed
    1. Holsberger DR, Cooke PS 2005 Understanding the role of thyroid hormone in Sertoli cell development: a mechanistic hypothesis. Cell Tissue Res 322:133–140 - PubMed
    1. Buzzard JJ, Morrison JR, O'Bryan MK, Song Q, Wreford NG 2000 Developmental expression of thyroid hormone receptors in the rat testis. Biol Reprod 62:664–669 - PubMed

Publication types

MeSH terms