

Reduction of hypothalamic protein tyrosine phosphatase improves insulin and leptin resistance in diet-induced obese rats
- PMID: 18467448
- PMCID: PMC2488223
- DOI: 10.1210/en.2007-1506
Reduction of hypothalamic protein tyrosine phosphatase improves insulin and leptin resistance in diet-induced obese rats
Erratum in
- Endocrinology. 2013 Apr;154(4):1667. Prada, Patrícia de Oliveira [corrected to Prada, Patricia Oliveira]
Abstract
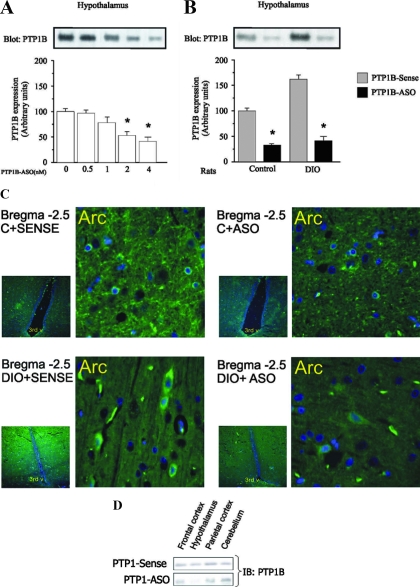
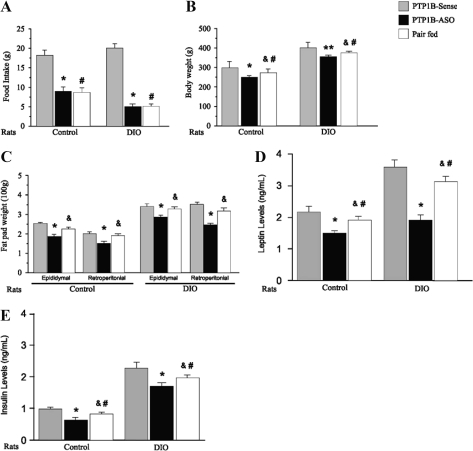
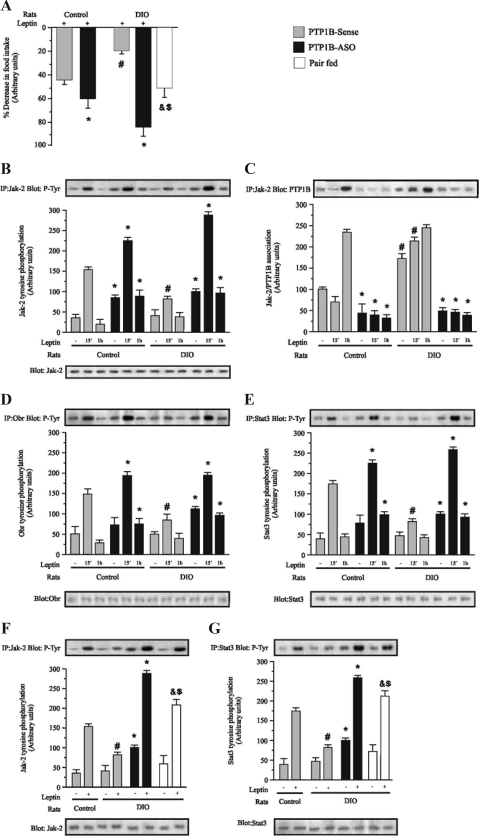
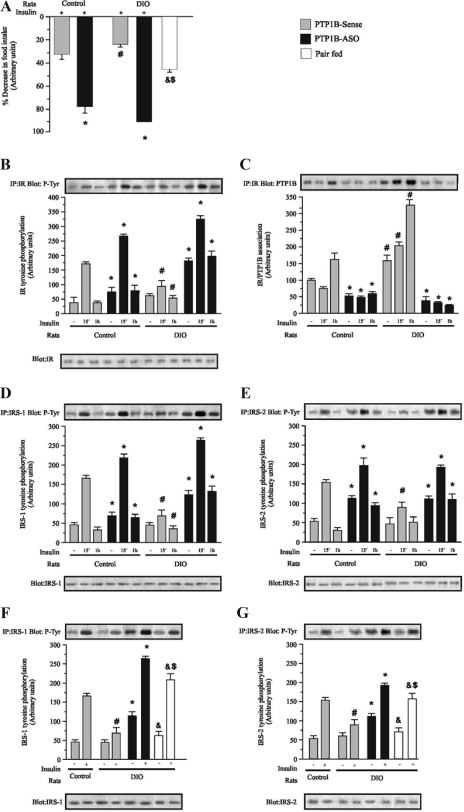
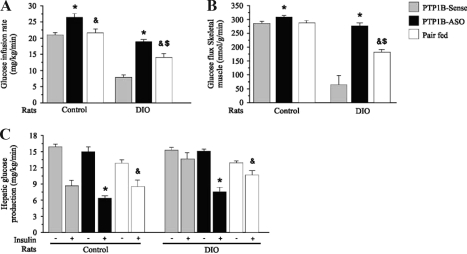
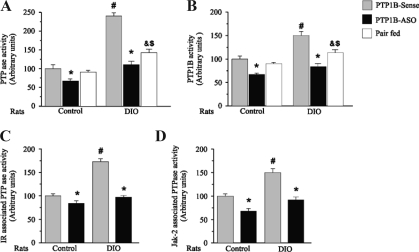
Protein tyrosine phosphatase (PTP1B) has been implicated in the negative regulation of insulin and leptin signaling. PTP1B knockout mice are hypersensitive to insulin and leptin and resistant to obesity when fed a high-fat diet. We investigated the role of hypothalamic PTP1B in the regulation of food intake, insulin and leptin actions and signaling in rats through selective decreases in PTP1B expression in discrete hypothalamic nuclei. We generated a selective, transient reduction in PTP1B by infusion of an antisense oligonucleotide designed to blunt the expression of PTP1B in rat hypothalamic areas surrounding the third ventricle in control and obese rats. The selective decrease in hypothalamic PTP1B resulted in decreased food intake, reduced body weight, reduced adiposity after high-fat feeding, improved leptin and insulin action and signaling in hypothalamus, and may also have a role in the improvement in glucose metabolism in diabetes-induced obese rats.
Figures
Similar articles
-
Leptin signalling pathways in hypothalamic neurons.Cell Mol Life Sci. 2016 Apr;73(7):1457-77. doi: 10.1007/s00018-016-2133-1. Epub 2016 Jan 19. Cell Mol Life Sci. 2016. PMID: 26786898 Free PMC article. Review.
-
HF diets increase hypothalamic PTP1B and induce leptin resistance through both leptin-dependent and -independent mechanisms.Am J Physiol Endocrinol Metab. 2009 Feb;296(2):E291-9. doi: 10.1152/ajpendo.90513.2008. Epub 2008 Nov 18. Am J Physiol Endocrinol Metab. 2009. PMID: 19017730 Free PMC article.
-
Intranasal Targeting of Hypothalamic PTP1B and TCPTP Reinstates Leptin and Insulin Sensitivity and Promotes Weight Loss in Obesity.Cell Rep. 2019 Sep 10;28(11):2905-2922.e5. doi: 10.1016/j.celrep.2019.08.019. Cell Rep. 2019. PMID: 31509751
-
Acute exercise suppresses hypothalamic PTP1B protein level and improves insulin and leptin signaling in obese rats.Am J Physiol Endocrinol Metab. 2013 Sep 1;305(5):E649-59. doi: 10.1152/ajpendo.00272.2013. Epub 2013 Jul 23. Am J Physiol Endocrinol Metab. 2013. Retraction in: Am J Physiol Endocrinol Metab. 2018 Jan 1;314(1):E104. doi: 10.1152/ajpendo.zh1-7843-retr.2017. PMID: 23880311 Retracted.
-
Protein Tyrosine Phosphatases in Hypothalamic Insulin and Leptin Signaling.Trends Pharmacol Sci. 2015 Oct;36(10):661-674. doi: 10.1016/j.tips.2015.07.003. Trends Pharmacol Sci. 2015. PMID: 26435211 Review.
Cited by
-
Hypothalamic inflammation and thermogenesis: the brown adipose tissue connection.J Bioenerg Biomembr. 2011 Feb;43(1):53-8. doi: 10.1007/s10863-011-9325-z. J Bioenerg Biomembr. 2011. PMID: 21271281 Review.
-
Leptin signalling pathways in hypothalamic neurons.Cell Mol Life Sci. 2016 Apr;73(7):1457-77. doi: 10.1007/s00018-016-2133-1. Epub 2016 Jan 19. Cell Mol Life Sci. 2016. PMID: 26786898 Free PMC article. Review.
-
Deficiency of PTP1B Attenuates Hypothalamic Inflammation via Activation of the JAK2-STAT3 Pathway in Microglia.EBioMedicine. 2017 Feb;16:172-183. doi: 10.1016/j.ebiom.2017.01.007. Epub 2017 Jan 9. EBioMedicine. 2017. PMID: 28094236 Free PMC article.
-
The effects of ondansetron on diabetes and high-fat diet-induced liver disease: a critical role for protein tyrosine phosphatase 1B.Front Pharmacol. 2025 Apr 28;16:1565628. doi: 10.3389/fphar.2025.1565628. eCollection 2025. Front Pharmacol. 2025. PMID: 40356976 Free PMC article.
-
Possible Pharmacological Approach Targeting Endoplasmic Reticulum Stress to Ameliorate Leptin Resistance in Obesity.Front Endocrinol (Lausanne). 2016 Jun 8;7:59. doi: 10.3389/fendo.2016.00059. eCollection 2016. Front Endocrinol (Lausanne). 2016. PMID: 27375555 Free PMC article. Review.
References
-
- Schwartz WM, Porte D 2005 Diabetes, obesity and the brain. Science 307:375–379 - PubMed
-
- Johnson TO, Ermolieff J, Jirousek MR 2002 Protein tyrosine phosphatase 1B inhibitors for diabetes. Nat Rev Drug Discov 1:696–709 - PubMed
-
- Prada PO, Zecchin HG, Gasparetti AL, Torsoni MA, Ueno M, Hirata AE, Corezola do Amaral ME, Hoer NF, Boschero AC, Saad MJ 2005 Western diet modulates insulin signaling, c-Jun N-terminal kinase activity, and insulin receptor substrate-1ser307 phosphorylation in a tissue-specific fashion. Endocrinology 146:1576–1587 - PubMed
-
- Goldstein BJ 2002 Protein-tyrosine phosphatases: emerging targets for therapeutic intervention in type 2 diabetes and related states of insulin resistance. J Clin Endocrinol Metab 87:2474–2480 - PubMed
-
- Bence KK, Delibegovic M, Xue B, Gorgun CZ, Hotamisligil GS, Neel BG, Kahn BB 2006 Neuronal PTP1B regulates body weight, adiposity and leptin action. Nat Med 8:917–924 - PubMed
MeSH terms
Substances
LinkOut - more resources
Full Text Sources
Medical
Miscellaneous
