. 2008 Aug;26(8):2019-31.
doi: 10.1634/stemcells.2007-1115. Epub 2008 May 8.

T-cell factor 3 regulates embryonic stem cell pluripotency and self-renewal by the transcriptional control of multiple lineage pathways

Affiliations

T-cell factor 3 regulates embryonic stem cell pluripotency and self-renewal by the transcriptional control of multiple lineage pathways

Wai-Leong Tam et al. Stem Cells. 2008 Aug.

Abstract

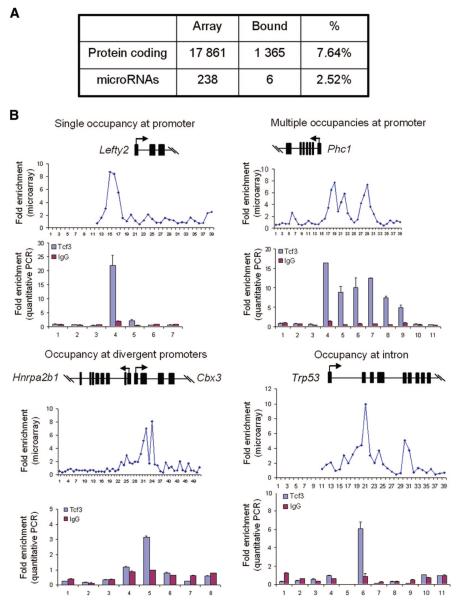
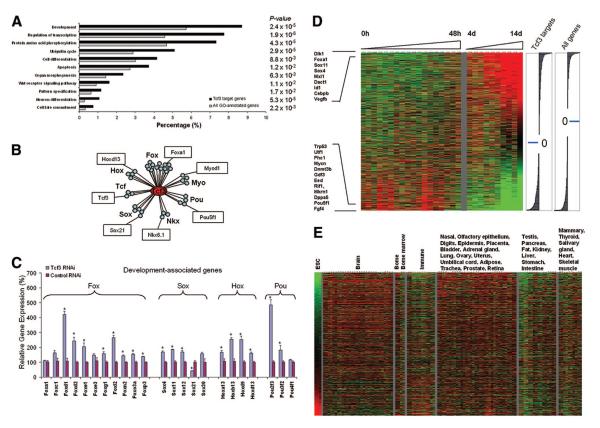
The Wnt signaling pathway is necessary both for maintaining undifferentiated stem cells and for directing their differentiation. In mouse embryonic stem cells (ESCs), Wnt signaling preferentially maintains "stemness" under certain permissive conditions. T-cell factor 3 (Tcf3) is a component of the Wnt signaling and a dominant downstream effector in ESCs. Despite the wealth of knowledge regarding the importance of Wnt signaling underlying stem cells functions, the precise mechanistic explanation by which the effects are mediated is unknown. In this study, we identified new regulatory targets of Tcf3 using a whole-genome approach and found that Tcf3 transcriptionally represses many genes important for maintaining pluripotency and self-renewal, as well as those involved in lineage commitment and stem cell differentiation. This effect is in part mediated by the corepressors transducin-like enhancer of split 2 and C-terminal Binding Protein (CtBP). Notably, Tcf3 binds to and represses the Oct4 promoter, and this repressive effect requires both the Groucho and CtBP interacting domains of Tcf3. Interestingly, we find that in mouse preimplantation development embryos, Tcf3 expression is coregulated with Oct4 and Nanog and becomes localized to the inner cell mass of the blastocyst. These data demonstrate an important role for Tcf3 in modulating the appropriate level of gene transcription in ESCs and during embryonic development. Disclosure of potential conflicts of interest is found at the end of this article.


Figures

Figure 1
Figure 1
Knockdown of Tcf3 in ESCs upregulates Oct4 and limits differentiation potential. (A): LIF was removed from culture media 24 h after control shRNA, vector, and Tcf3 shRNA transfection. Puromycin (1 μgml-1) was added to select for transfected cells. By d 7, Tcf3 shRNA-treated cells formed ESC colonies that could be propagated in the absence of LIF. Immunostaining showed that Tcf3 shRNA treatment in the absence of LIF maintained strong SSEA1 and AP expression. At least two different shRNA designs were used, and results were comparable (data not shown). Scale bars = 200 μm. (B): Control shRNA, vector, and Tcf3 shRNA-transfected stable ESC clones were generated, and one representative clone for each condition is presented. Tcf3 shRNA clones maintained spherical and intact EBs that stained positive for AP after 21 d, whereas control shRNA and vector-treated clones showed signs of disintegration with the appearance of cavities indicative of differentiation and negative for AP. Scale bars = 200 μm (left column) and 150 μm (right column). (C): Retinoic acid (RA) treatment of control shRNA ESCs showed extensive differentiation to flattened cells, with the loss of colony forming ability by d 5. Tcf3 shRNA ESCs maintained colony structures along with differentiated cells after 5 d of RA treatment. These cells could be propagated at least five times in the presence of RA, whereas control shRNA cells could not. During RA treatment, Tcf3 shRNA ESCs were able to maintain higher levels of Oct4 and Sox2 transcripts compared with control shRNA cells. Scale bar = 100 μm; error bars represent SEM. (D): Knockdown of Tcf3-upregulated Oct4, Utf1, Sox2, and Hist1h1b transcript levels after 3 d of transfection. *, significantly different from control shRNA control; p < .01; n = 3. Error bars represent SEM. (E): In both the presence and the absence of LIF, transient treatment of ESCs with Tcf3 shRNA upregulated the levels of Nanog and Oct4 proteins by 48 h. (F): Knockdown of Tcf3, but not Tcf2, Tcf4, or Lef1, upregulated Oct4 promoter activity in mouse ESCs, relative to control shRNA. Oct4 RNAi served as a positive control, whereas vector transfection served as a negative control. Four shRNAs were constructed for each gene to ensure specificity. *, significantly different from control shRNA control; p < .01; n = 3. Error bars represent SEM. Abbreviations: AP, alkaline phosphatase; d, day(s); h, hour(s); LIF, leukemia inhibitory factor; RNAi, RNA interference; shRNA, short hairpin; Tcf3, T-cell factor 3.
Figure 2
Figure 2
Genome-wide location analysis of Tcf3 in mouse ESCs. (A): Tcf3-bound DNA fragments were immunoprecipitated, amplified, dye-labeled, and hybridized to DNA microarrays containing 45–60-mer probes that span -5.5 to +2.5 kilobases for 17,861 annotated mouse genes, relative to the transcription start sites. The Whitehead Neighborhood Model, P(Xbar) < 0.001, with intra-array median normalization was performed to identify bound target genes. It was found that 7.64% of protein-coding and 2.52% of microRNA genes were occupied by Tcf3. (B): Examples of Tcf3-bound genes. Microarray plots display normalized ChIP-enrichment ratios over input DNA for all probes within the genomic region. Quantitative real-time PCR scanning of the promoters was performed to confirm the enriched probe locations that corresponded to the microarray plot. Tcf3 bound to promoters at several configurations: single occupancy at the promoter (Lefty2), multiple sites on a promoter (Phc1), single occupancy of divergent promoters of two genes (Hnrpa2b1 and Cbx3), and occupancy at the intronic region (Trp53). Control immunoprecipitation was carried out with IgG antibody. Abbreviations: PCR, polymerase chain reaction; Tcf3, T-cell factor 3.
Figure 3
Figure 3
Tcf3 regulates pluripotency-associated genes. (A): Genes co-occupied by Tcf3, Oct4, and Nanog. From Loh et al. [23], 324 genes out of 356 genes cobound by Oct4 and Nanog could be mapped to the mouse promoter microarray. Of these, 52 genes were also bound by Tcf3. Notable examples implicated in ESC pluripotency were listed. (B): Different configurations of Tcf3, Oct4, and Nanog binding to genes. Exons are depicted in black boxes, and the arrows indicate the direction of each gene. The numbers on the right indicate the span from the first to the last exon. Note that the complete Tcf3 binding profile may not be represented, as the promoter microarrays do not cover the entire genomic region depicted. The binding of Tcf3 on Nanog was based on [16]. (C): Upon Tcf3 RNAi knockdown, most pluripotency-associated targets of Tcf3 became upregulated, relative to control RNAi. *, significantly different from control; p < .01; n = 4. Error bars represent SEM. Abbreviations: bp, base pairs; RNAi, RNA interference; Tcf3, T-cell factor 3.
Figure 4
Figure 4
Tcf3 regulates developmentally associated genes that are upregulated during ESC differentiation. (A): Gene Ontology (GO) analysis of Tcf3 target genes. Black bars represent the percentage of Tcf3 target genes in a particular GO category, and gray bars represent the percentage expected of all GO-annotated mouse genes on the microarray. The p value of this representation is based on a hypergeometric distribution. Top selected representations based on p value are shown. The complete list is given in supplemental online Table 2. (B): Examples of developmental transcription factor families bound by Tcf3. Tcf3 is represented by the red oval; individual transcription factors are represented by circles and grouped by families as indicated (supplemental online Table 3). Examples of transcription factors with defined roles in development are labeled. Transcription factor families include Hox, Fox, Tcf, Sox, Myo, Tbx, Nkx, Pax, and Pou. (C): Developmentally associated target genes belonging to the Fox, Sox, Hox, and Pou families are predominantly upregulated after Tcf3 RNAi depletion in ESCs. Two of the Fox members (Foxo6 and Foxf12) bound were not detected by quantitative polymerase chain reaction. (D): Tcf3 target genes were dynamically regulated during ESC differentiation. Expression profiling data sets during differentiation of ESCs into EBs were obtained [30]. Only Tcf3 target genes are shown. Green and red represent lower-than-average and higher-than-average expression intensities, respectively (supplemental online Table 4). The right panels show the ratio of the average signal value for undifferentiated ESCs and ESCs differentiated for 14 d for probes representing Tcf3 target genes analyzed and for all probes on the array, represented as the distribution of log2-transformed ratios for transcripts that are up- or downregulated by more than 1.5-fold in both experimental groups. (E): Expression of inactive Tcf3 target genes was upregulated in differentiated tissue types compared with undifferentiated ESCs. Gene expression data for ESCs were compared with a compendium of mouse expression data representing 54 other differentiated tissues and cell types [31] (supplemental online data; supplemental online Table 5). Abbreviations: d, day(s); Fox, forkhead box; h, hour(s); Hox, homeobox protein; Myo, myogenic basic domain; Nkx, NK transcription factor-related; Pax, paired box and paired-like; Pou, Pou domain-containing; RNAi, RNA interference; Sox, Sry box; Tbx, T-box; Tcf, T-cell factor.
Figure 5
Figure 5
TLE2 and Tcf3 co-occupy the same target genes. (A): Tcf3 target genes were bound by TLE2 but not β-catenin. TLE2 immunoprecipitation (IP) showed strong enrichment for the same bound genes as Tcf3 in all instances examined. β-Catenin IP did not show appreciable enrichment. Hgf, Gpr154, and Spata19 were used as negative controls not bound by Tcf3. (B): Occupancy of Tcf3 and TLE2 occurred at the same genomic locus of Lefty2, Oct4, and Trp53. CtBP was observed to bind only Oct4, whereas β-catenin was not enriched at any of the repressed genes. All measurements were performed using quantitative polymerase chain reaction. (C): Sequential IP of Tcf3 followed by TLE2 showed enrichment of Tcf3 target genes. (D): Sequential IP of TLE2 followed by Tcf3 similarly showed enrichment of Tcf3 target genes. Abbreviation: Tcf3, T-cell factor 3.
Figure 6
Figure 6
Tcf3 represses Oct4 promoter. (A): Illustration of the mouse 3-kb Oct4 promoter with PE and DE. CR1—CR4 represent conserved regions of the promoter shared with human and rat. Seven putative Tcf/Lef binding sites are shown. M1—M4 represent each of the four constructs containing directed mutagenesis on the Tcf/Lef binding motif. (B): Chromatin immunoprecipitation analysis showed Tcf3 occupancy at two sites on the Oct4 promoter, corresponding to M1 and M2 near CR4, as well as M3 and M4 near CR2. Control IP was performed with IgG antibody and did not show any enrichment. Ten primer pairs were designed to scan the region of analysis. (C): Tcf3 overexpression repressed firefly luciferase activity driven by the WT Oct4 promoter to less than 50%, relative to vector control. Mutation of either site M2 or M4 did not affect Tcf3 repression of the mutant promoter. However, mutation of site M1 or M3 prevented Tcf3-mediated repression. Luciferase measurements were performed 48 hours post-transfection into HEK293 cells. *, significantly different from control short hairpin (shRNA); p < .01; n = 3 in three independent experiments. Error bars represent SEM. (D): Tcf3 mutant proteins were generated as depicted in the diagram. WT Tcf3 contains β-catenin, Groucho/TLE, and CtBP interaction domains and an HMG DNA binding domain. Tcf3 Δβ 48aa: 48-aa deletion from N terminus. Tcf3 Δβ 71aa: 71-aa deletion from N terminus. Tcf3 ΔGrg: 174-aa deletion of the Groucho/TLE interacting domain. Tcf3 ΔCtBP: 106-aa deletion from the C terminus. (E): Tcf3 Δβ 48aa and Tcf3 Δβ 71aa were able to mediate repression of the WT Oct4 promoter as with WT Tcf3. Disruption of either Groucho/TLE or CtBP interacting blocks the ability of mutant Tcf3 to repress Oct4 promoter. A noticeable upregulation of the luciferase activity was observed instead. Luciferase measurements were performed 48 hours post-transfection into HEK293 cells. Firefly luciferase measurements were relative to vector-transfected control. *, significantly different from control shRNA control; p < .01; n = 3 in three independent experiments. Error bars represent SEM. (F): The repression of the Oct4 promoter by Tcf3 overexpression was relieved by the addition of Wnt3A CM, whereas the enhanced activation of the promoter was observed with Oct4 overexpression. *, significantly different from —Wnt3A control; p < .01; n = 3 in three independent experiments. Error bars represent SEM. Abbreviations: aa, amino acid(s); CM, conditioned medium; DE, distal enhancer; HMG, high-mobility group; IP, immunoprecipitation; kb, kilobase; PE, proximal enhancer; Tcf3, T-cell factor 3; WT, wild-type.
Figure 7
Figure 7
The role of Tcf3 during embryonic development and in ESCs. (A): Expression profiling of Tcf3 and Nanog during mouse preimplantation development showed that Nanog protein appeared in the mouse embryo from the morula stage onward and became localized to the inner cell mass (ICM) of the blastocyst (E3.5 and E4.5) but not the trophectoderm. Tcf3 protein appeared in the four-cell-stage embryo, and expression was maintained at the eight-cell and morula stages and became restricted to the ICM but not trophectoderm. Scale bar = 20 μm. Oct4 expression is given in supplemental online Fig. 13. (B): Schematic representation of the role of Tcf3 in ESCs. Tcf3 represses certain signaling pathways and oncogene families, in addition to developmentally associated genes. This prevents inappropriate activation of differentiation programs in ESCs. Tcf3 also regulates pluripotency-associated genes. Oct4 and Nanog are key Tcf3 targets that can be activated by other factors, such as Oct4, Nanog, Sox2, Sall4, LRH1, and Tpt1. Excessive levels of Oct4 drive ESCs into the endodermal lineage, whereas high levels of Nanog limit differentiation potential. Tcf3 serves as a repressor, as does GCNF, to attenuate Oct4 and Nanog levels among other pluripotency-associated factors. Abbreviations: DAPI, 4,6-diamidino-2-phenylindole; E, embryonic day; Tcf3, T-cell factor 3.

Similar articles

Cited by

References

    1. Logan CY, Nusse R. The Wnt signaling pathway in development and disease. Annu Rev Cell Dev Biol. 2004;20:781–810. - PubMed
    1. Lagutin OV, Zhu CC, Kobayashi D, et al. Six3 repression of Wnt signaling in the anterior neuroectoderm is essential for vertebrate forebrain development. Genes Dev. 2003;17:368–379. - PMC - PubMed
    1. Zechner D, Fujita Y, Hulsken J, et al. beta-Catenin signals regulate cell growth and the balance between progenitor cell expansion and differentiation in the nervous system. Dev Biol. 2003;258:406–418. - PubMed
    1. Hirabayashi Y, Itoh Y, Tabata H, et al. The Wnt/beta-catenin pathway directs neuronal differentiation of cortical neural precursor cells. Development. 2004;131:2791–2801. - PubMed
    1. Huelsken J, Vogel R, Erdmann B, et al. beta-Catenin controls hair follicle morphogenesis and stem cell differentiation in the skin. Cell. 2001;105:533–545. - PubMed

Publication types