

Co-localization of amyloid beta and tau pathology in Alzheimer's disease synaptosomes
- PMID: 18467692
- PMCID: PMC2408427
- DOI: 10.2353/ajpath.2008.070829
Co-localization of amyloid beta and tau pathology in Alzheimer's disease synaptosomes
Abstract
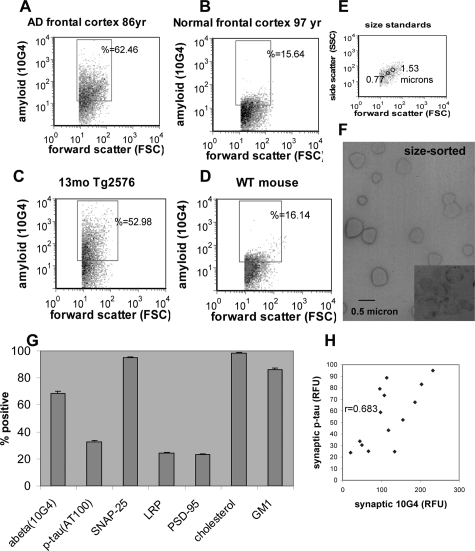
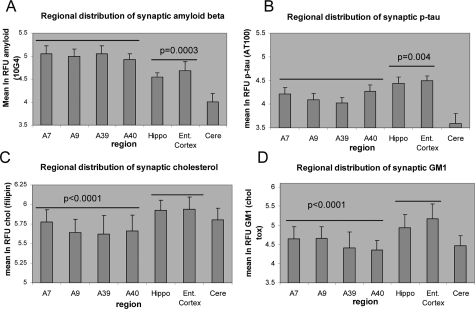
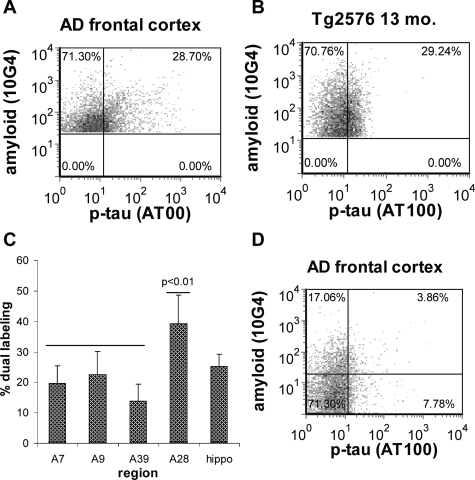
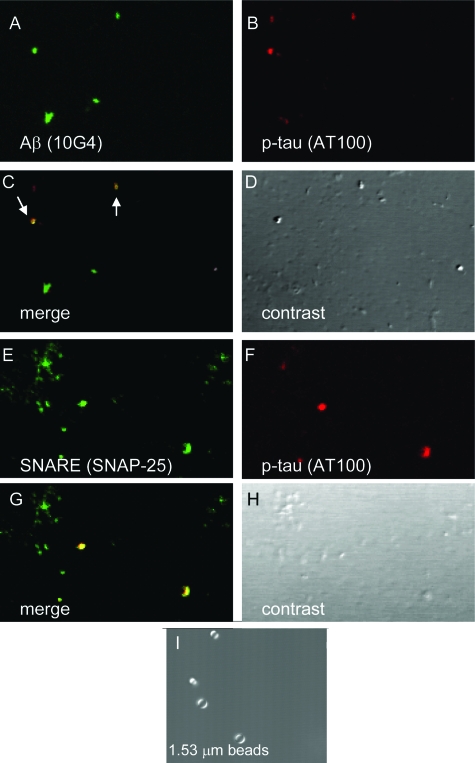
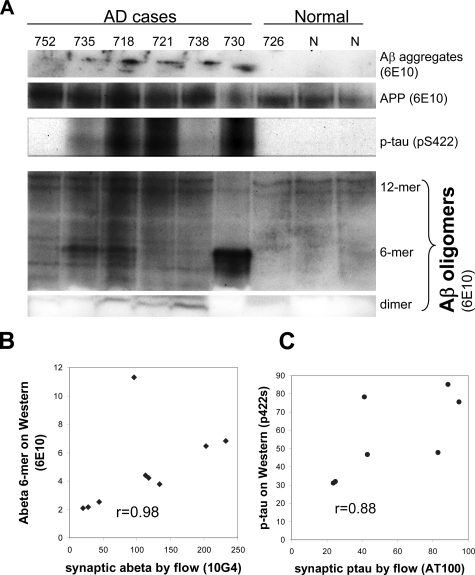
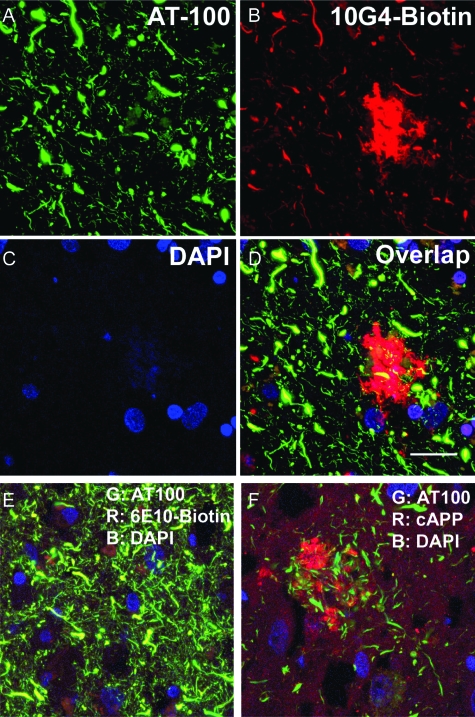
The amyloid cascade hypothesis proposes that amyloid beta (Abeta) pathology precedes and induces tau pathology, but the neuropathological connection between these two lesions has not been demonstrated. We examined the regional distribution and co-localization of Abeta and phosphorylated tau (p-tau) in synaptic terminals of Alzheimer's disease brains. To quantitatively examine large populations of individual synaptic terminals, flow cytometry was used to analyze synaptosomes prepared from cryopreserved Alzheimer's disease tissue. An average 68.4% of synaptic terminals in the Alzheimer's disease cohort (n = 11) were positive for Abeta, and 32.3% were positive for p-tau; Abeta and p-tau fluorescence was lowest in cerebellum. In contrast to synaptic p-tau, which was highest in the entorhinal cortex and hippocampus (P = 0.004), synaptic Abeta fluorescence was significantly lower in the entorhinal cortex and hippocampus relative to neocortical regions (P = 0.0003). Synaptic Abeta and p-tau fluorescence was significantly correlated (r = 0.683, P < 0.004), and dual-labeling experiments demonstrated that 24.1% of Abeta-positive terminals were also positive for p-tau, with the highest fraction of dual labeling (39.3%) in the earliest affected region, the entorhinal cortex. Western blotting experiments show a significant correlation between synaptic Abeta levels measured by flow cytometry and oligomeric Abeta species (P < 0.0001). These results showing overlapping Abeta and tau pathology are consistent with a model in which both synaptic loss and dysfunction are linked to a synaptic amyloid cascade within the synaptic compartment.
Figures
References
-
- Arriagada PV, Growdon JH, Hedley-Whyte ET, Hyman BT. Neurofibrillary tangles but not senile plaques parallel duration and severity of Alzheimer’s disease. Neurology. 1992;42:631–639. - PubMed
-
- Bierer LM, Hof PR, Purohit DP, Carlin L, Schmeidler J, Davis KL, Perl DP. Neocortical neurofibrillary tangles correlate with dementia severity in Alzheimer’s disease. Arch Neurol. 1995;52:81–88. - PubMed
-
- McLean CA, Cherny RA, Fraser FW, Fuller SJ, Smith MJ, Beyreuther K, Bush AI, Masters CL. Soluble pool of Abeta amyloid as a determinant of severity of neurodegeneration in Alzheimer’s disease. Ann Neurol. 1999;46:860–866. - PubMed
-
- Kuo YM, Emmerling MR, Vigo-Pelfrey C, Kasunic TC, Kirkpatrick JB, Murdoch GH, Ball MJ, Roher AE. Water-soluble Abeta (N-40. N-42) oligomers in normal and Alzheimer disease brains. J Biol Chem. 1996;271:4077–4081. - PubMed
-
- Naslund J, Haroutunian V, Mohs R, Davis KL, Davies P, Greengard P, Buxbaum JD. Correlation between elevated levels of amyloid beta-peptide in the brain and cognitive decline. JAMA. 2000;283:1571–1577. - PubMed
Publication types
MeSH terms
Substances
Grants and funding
- 5AG016570/AG/NIA NIH HHS/United States
- P50 AG005142/AG/NIA NIH HHS/United States
- R01 NS043946/NS/NINDS NIH HHS/United States
- 050 AG05142/AG/NIA NIH HHS/United States
- AI 28697/AI/NIAID NIH HHS/United States
- P50 AG 16570/AG/NIA NIH HHS/United States
- NS43946/NS/NINDS NIH HHS/United States
- R01 AG018879/AG/NIA NIH HHS/United States
- P50 AG016570/AG/NIA NIH HHS/United States
- P30 CA016042/CA/NCI NIH HHS/United States
- P30 AI028697/AI/NIAID NIH HHS/United States
- CA 16042/CA/NCI NIH HHS/United States
- AG18879/AG/NIA NIH HHS/United States
LinkOut - more resources
Full Text Sources
Other Literature Sources
Medical
Molecular Biology Databases
