. 2008 Jun;172(6):1650-63.
doi: 10.2353/ajpath.2008.071049. Epub 2008 May 8.

CD19 regulates skin and lung fibrosis via Toll-like receptor signaling in a model of bleomycin-induced scleroderma

Affiliations

CD19 regulates skin and lung fibrosis via Toll-like receptor signaling in a model of bleomycin-induced scleroderma

Ayumi Yoshizaki et al. Am J Pathol. 2008 Jun.

Abstract

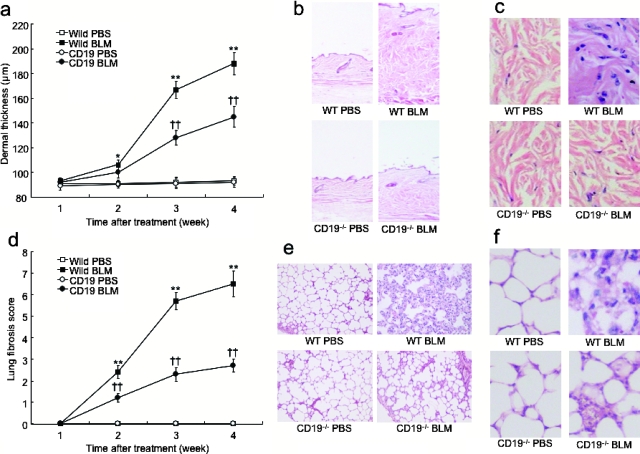
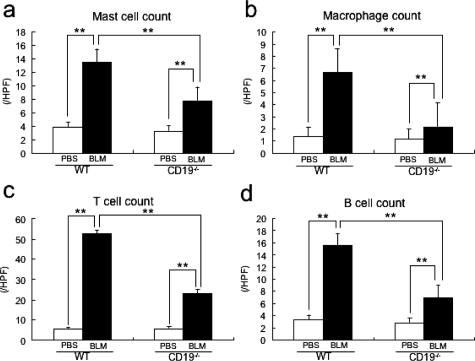
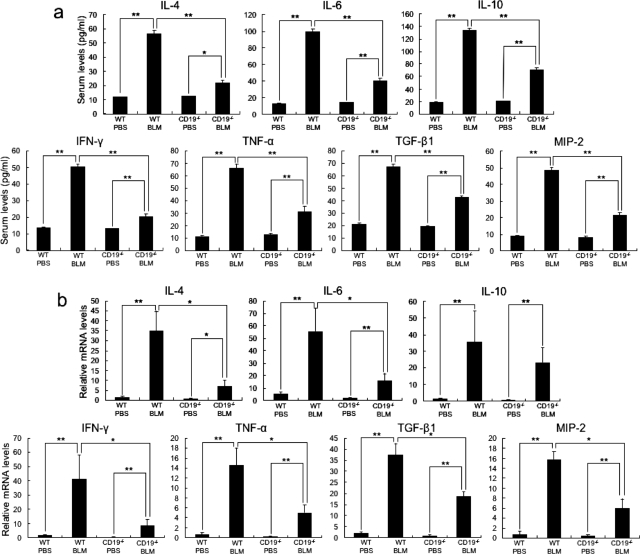
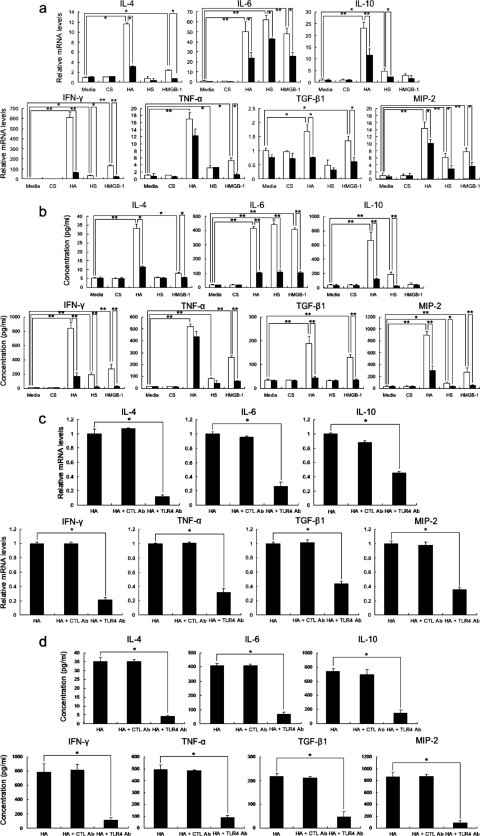
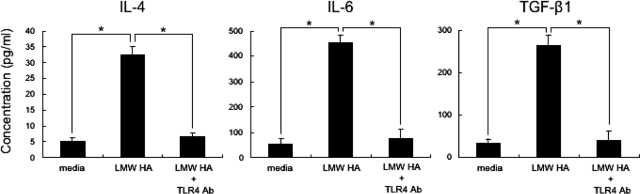
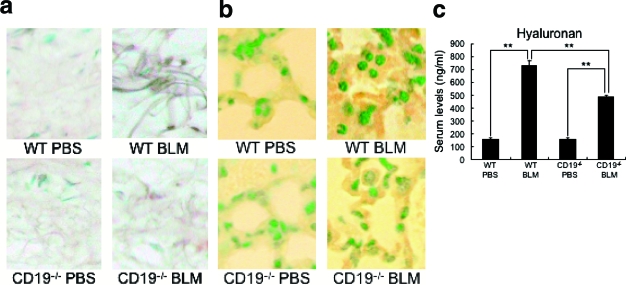
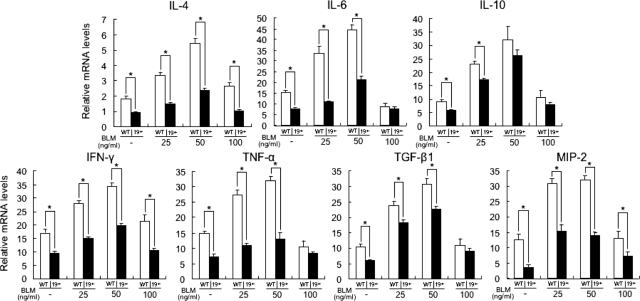
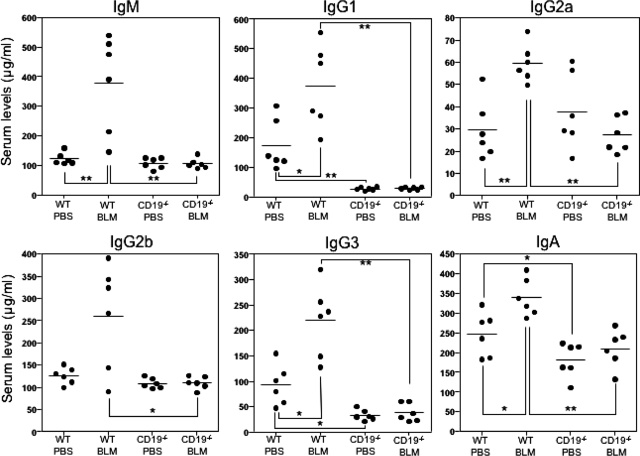
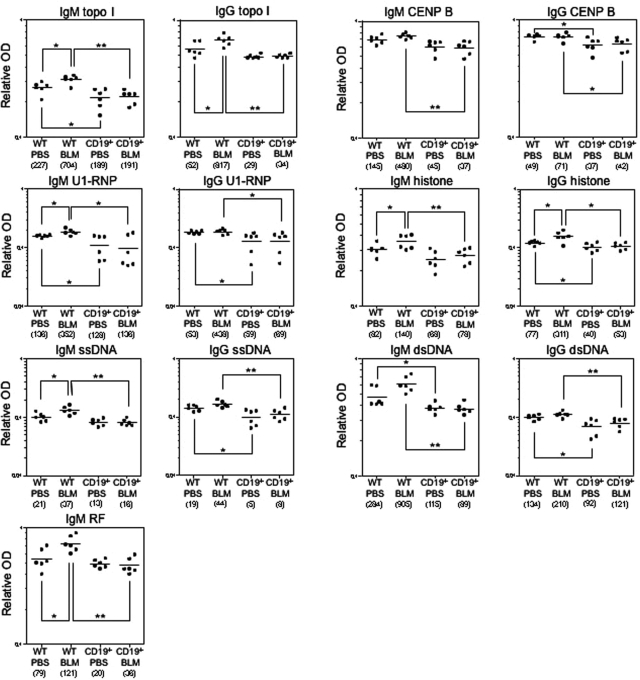
Mice subcutaneously injected with bleomycin, in an experimental model of human systemic sclerosis, develop cutaneous and lung fibrosis with autoantibody production. CD19 is a general "rheostat" that defines signaling thresholds critical for humoral immune responses, autoimmunity, and cytokine production. To determine the role of CD19 in the bleomycin-induced systemic sclerosis model, we investigated the development of fibrosis and autoimmunity in CD19-deficient mice. Bleomycin-treated wild-type mice exhibited dermal and lung fibrosis, hyper-gamma-globulinemia, autoantibody production, and enhanced serum and skin expression of various cytokines, including fibrogenic interleukin-4, interleukin-6, and transforming growth factor-beta1, all of which were inhibited by CD19 deficiency. Bleomycin treatment enhanced hyaluronan production in the skin, lung, and sera. Addition of hyaluronan, an endogenous ligand for Toll-like receptor (TLR) 2 and TLR4, stimulated B cells to produce various cytokines, primarily through TLR4; CD19 deficiency suppressed this stimulation. These results suggest that bleomycin induces fibrosis by enhancing hyaluronan production, which activates B cells to produce fibrogenic cytokines mainly via TLR4 and induce autoantibody production, and that CD19 deficiency suppresses fibrosis and autoantibody production by inhibiting TLR4 signals.


Figures

Figure 1
Figure 1
Skin (a–c) and lung (d–f) fibrosis from WT and CD19−/− mice treated with either BLM or PBS. Skin and lung fibrosis was assessed by quantitatively measuring dermal thickness (a) and lung fibrosis score (d) 1, 2, 3, and 4 weeks after BLM treatment. Representative histological sections stained with H&E are shown. These results represent those obtained with at least 10 mice of each group. The dermal thickness and lung fibrosis score were measured under a light microscope. Each histogram shows the mean (±SD) results obtained for 10 mice of each group. *P < 0.05, **P < 0.005 versus PBS-treated mice and ††P < 0.005 versus BLM-treated WT mice. Original magnifications: ×40 (b, e); ×200 (c, f).
Figure 2
Figure 2
The number of mast cells (a), macrophages (b), T cells (c), and B cells (d) at the BLM-injected site of skin from PBS- or BLM-treated WT and CD19−/− mice. Mast cells were identified by toluidine blue staining, whereas macrophages, T cells, and B cells were stained with F4/80, anti-CD3 mAb, and anti-B220 mAb, respectively. Cells were counted in 10 random grids under magnification of ×400 high-power fields (HPF). Each histogram shows the mean (±SD) results obtained for 10 mice of each group. **P < 0.005.
Figure 3
Figure 3
Levels of IL-4, IL-6, IL-10, IFN-γ, TNF-α, TGF-β1, and MIP-2 in serum samples (a) and their mRNA expression in the skin (b) from WT and CD19−/− mice treated with either PBS or BLM. Serum cytokine levels were assessed using specific ELISA. Total RNA was isolated from lower back skin and mRNA expression was analyzed using real-time PCR. Each histogram shows the mean (±SD) results obtained for six mice of each group. *P < 0.05, **P < 0.005.
Figure 4
Figure 4
Cytokine mRNA expression (a) and protein production (b) by WT (white bar) and CD19−/− (black bar) B cells stimulated with chondroitin sulfate (CS), hyaluronan (HA), heparan sulfate (HS), or HMGB-1. Purified splenic B cells from WT and CD19−/− mice were stimulated with either media alone, CS, HA, HS, or HMGB-1 for 10 hours. Inhibition of HA-induced cytokine mRNA expression (c) and protein production by anti-TLR4 mAb (d). Purified splenic B cells from WT and CD19−/− mice were treated with HA and either of anti-TLR4 mAb or control (CTL) Ab. Levels of mRNA expression of IL-4, IL-6, IL-10, IFN-γ, TNF-α, TGF-β1, and MIP-2 were analyzed using real-time PCR. Concentration of these cytokines was analyzed using specific ELISA. Each histogram shows the mean (±SD) results obtained for six mice of each group. *P < 0.05, **P < 0.005.
Figure 5
Figure 5
Cytokine production by WT B cells stimulated with low-molecular weight (LMW) HA, and inhibition of LMW HA-induced cytokine production by anti-TLR4 mAb. Purified splenic B cells from WT mice were stimulated with LMW HA in the absence or presence of anti-TLR4 mAb for 10 hours. Concentrations of IL-4, IL-6, and TGF-β1 were analyzed using specific ELISA. Each histogram shows the mean (±SD) results obtained for six mice of each group. *P < 0.05.
Figure 6
Figure 6
Hyaluronan expression in the skin (a), lung (b), and serum (c) from PBS- or BLM-treated WT and CD19−/− mice. Hyaluronan was stained by biotinylated hyaluronic acid binding protein. The amount of hyaluronan in the serum was quantified using specific ELISA. Histogram shows the mean (±SD) results obtained for six mice of each group. **P < 0.005. Original magnifications, ×200.
Figure 7
Figure 7
The effect of BLM on cytokine production by WT and CD19−/− (19−/−) B cells stimulated with LPS. Purified splenic B cells were stimulated with 25, 50, or 100 ng/ml of BLM in the presence of LPS (1 μg/ml) for 10 hours. Expression of IL-4, IL-6, IL-10, IFN-γ, TNF-α, TGF-β1, and MIP-2 mRNA was analyzed using real-time PCR. Each histogram shows the mean (±SD) results obtained for six mice of each group. *P < 0.05.
Figure 8
Figure 8
Serum Ig levels in PBS- or BLM-treated WT and CD19−/− mice. Serum samples were obtained by a cardiac puncture 4 weeks after treatment with either BLM or PBS. Serum Ig levels were determined by isotype-specific ELISAs. Horizontal bars represent mean Ig levels. *P < 0.05, **P < 0.005.
Figure 9
Figure 9
Autoantibody levels in sera from PBS- or BLM-treated WT and CD19−/− mice. Relative autoantibody levels were determined by Ig subclass-specific ELISA. Values in parentheses represent the dilutions of pooled sera giving half-maximal OD values in autoantigen-specific ELISAs, which were determined by linear regression analysis to generate arbitrary units per ml that could be directly compared between each group of mice (n = 6 for each). Horizontal bars represent mean Ab levels. *P < 0.05, **P < 0.005.

References

    1. LeRoy EC, Krieg T, Black C, Medsger TAJ, Fleischmajer R, Rowell N, Jablonska S, Wollheim F. Scleroderma (systemic sclerosis): classification, subsets, and pathogenesis. J Rheumatol. 1988;15:202–205. - PubMed
    1. Okano Y. Antinuclear antibody in systemic sclerosis (scleroderma). Rheum Dis Clin North Am. 1996;22:709–735. - PubMed
    1. Sato S, Fujimoto M, Hasegawa M, Takehara K. Altered blood B lymphocyte homeostasis in systemic sclerosis: expanded naive B cells and diminished but activated memory B cells. Arthritis Rheum. 2004;50:1918–1927. - PubMed
    1. Gudbjornsson B, Hallgren R, Nettelbladt O, Gustafsson R, Mattsson A, af Geijerstam E, Totterman TH. Phenotypic and functional activation of alveolar macrophages. T lymphocytes and NK cells in patients with systemic sclerosis and primary Sjogren’s syndrome. Ann Rheum Dis. 1994;53:574–579. - PMC - PubMed
    1. Kalogerou A, Gelou E, Mountantonakis S, Settas L, Zafiriou E, Sakkas L. Early T cell activation in the skin from patients with systemic sclerosis. Ann Rheum Dis. 2005;64:1233–1235. - PMC - PubMed

Publication types

MeSH terms